
How do you use linear regression functions?
Once you have found a linear model using linear regression, you can use it to analyze problems. These problems may involve questions about the slope or the variables.
Example 1 Use a Linear Model
The least squares linear model for the data in Table 1 is P = -0.0395Q + 7.0675.
a. Use this model to determine the average price when 100 thousand gallons of milk are sold.
Solution This equation relates Q, the quantity of milk sold in thousands of gallons, to the average price P. Since we are given a value of substitute this into the model:
P = -0.0395(100) + 7.0675 ≈ 3.12
At a price of $3.12, 100 thousand gallons of milk are demanded per week.
b. Use this model to determine the amount of milk sold per week when the average price per gallon is $2.90.
Solution In this part, a price of P = 2.90 is specified. We can substitute this value into the model and solve for Q to get the quantity.
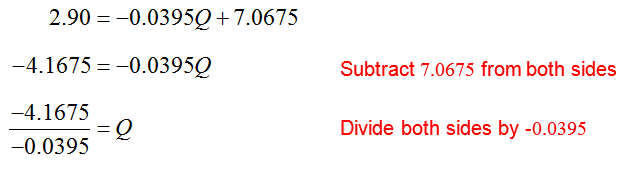
This fraction is approximately 105.506 thousand gallons of milk or about 105,506 gallons of milk per week.
Example 2 Interpret the Slope of the Model
The least squares linear model for the data in Table 1 is P = -0.0395Q + 7.0675. Use this model to determine the rate at which the prices are changing with respect to quantity.
Solution The rate at which the variables change with respect to each other is the slope of the model.
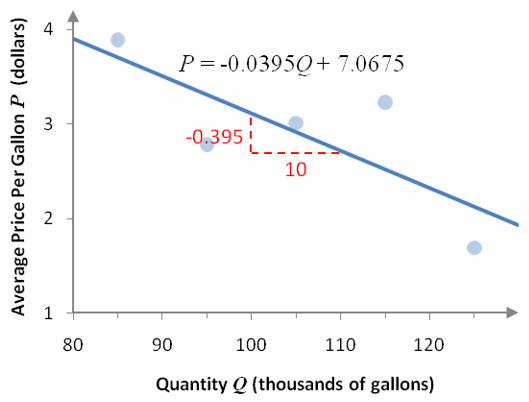
Figure 7 – A graph of the model with the slope labeled as a ratio.
The slope, -0.0395, is the coefficient of the independent variable Q. However, giving the number as the rate is not complete. A rate should include units. This allows you to understand what the rate means.
In Figure 7, the slope of the model is labeled so that the ratio of the vertical change to the horizontal change is
This tells us that for every 10,000 gallon increase in demand, the price per gallon drops .395 dollars or 39.5 cents.
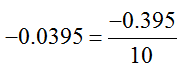
We could also write the ratio as

In this case, we would interpret this as a decrease of 10,000 gallons in demand leads to an increase in price of .395 dollars or 39.5 cents.
In general, rates are interpreted in 1 unit increments of the independent variable. Writing the ratio as
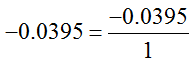
means that for every 1 thousand gallon increase in demand, the price drops by 0.0395 dollars or 3.95 cents. We can state this easily by saying that the rate is -0.0395 dollars per thousand gallons. The units include the term “per” meaning that the units are a ratio of dollars to thousands of gallons.