
What is function notation?
Problems in business and finance are often mathematical in nature. These problems come from real-world situations that can be extremely complex. A mathematical model is a mathematical representation of the situation. Often these representations take the form of functions.
The price of a product may be constant or it may change in response to the quantity sold. If the quantity of some product sold increases, the price may decreases. A demand function displays the relationship between the price per unit P of a product and the quantity Q demanded by consumers. For example, the relationship for a certain product may be
P = -0.0002Q + 55
We say that the price P is a function of the quantity Q. By saying “function of quantity Q”, we are indicating that the independent variable is Q and the dependent variable is P. The same relationship can also be written as
Q = -5000P + 275000
Now the quantity Q is a function of the price P. This means that P is the independent variable and Q is the dependent variable.
Function notation is used to emphasize the independent variable in a function. Functions are named with a letter or phrase. Next to the name is a set of parentheses with the independent variable inside. For a demand function, we might use the letter D to name the function. For the two equations above, we would write
D(Q) = -0.0002Q + 55 or D(P) = -5000P + 275000
Knowing what the independent variable is helps us to determine the input to and out from the function. For instance, if we need to find the price of the product when the quantity demanded is 10,000 units we would set Q = 10,000 in D(Q) = -0.0002Q + 55. We indicate this by writing
D(10000) = -0.0002(10000) + 55 = 53
In the function notation, each Q is set equal to 10,000. Since the input is a quantity, the output must be the corresponding price.
It may seem tedious to replace P with D(Q) to define a function. However, in many situations we need to work with two equations simultaneously. Without a name for the function, we would have a difficult time distinguishing the two formulas.
Example 6 Supply Functions
A supply function also displays the relationship between the price and the quantity of a product. Unlike the demand function, the supply function models the price P at which suppliers are willing to supply Q units of the product. Suppose this relationship is
P = 0.0001Q
a. Use function notation to define the supply function as a function of the quantity Q. Use the letter S to name the function.
Solution Using the name S and the independent variable Q, the appropriate function notation is S(Q). The function definition is
S(Q) = 0.0001Q
b. Use the function definition to find the price P at which suppliers would be willing to supply 20,000 units.
Solution Set in the function to yield
S(20000) = 0.0001(20000) = 2
At a price of $2 per units, suppliers would be willing to supply 20,000 units.
c. What does it mean for S(Q) = 20?
Solution When the function notation is set equal to a number, the output from the function is being given. In this case, the price is equal to $20. If we replace the function notation with its formula, we can solve the resulting equation to find the quantity Q corresponding to a price of $20:
At a price of $20 per unit, suppliers are willing to supply 200,000 units.
Typically, the demand and supply functions for a product are graphed together. Let’s put the two functions we have been using together.
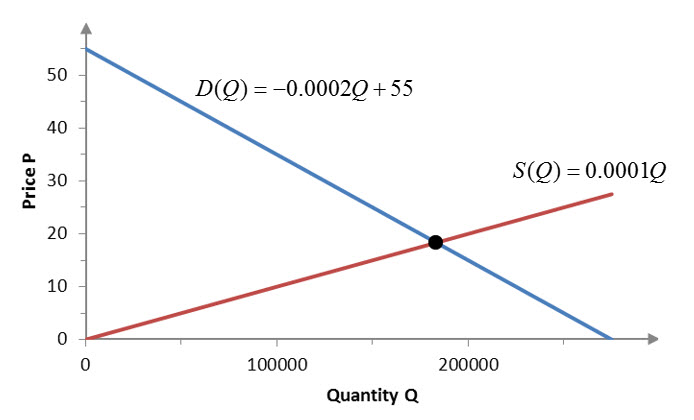
Figure 3 – The equilibrium point is the point of intersection of the demand and supply functions.
On this graph, the two functions cross. At the point of intersection, the quantity that consumers are willing to buy is equal to the quantity that manufacturers are willing to supply. We can find this point algebraically by setting the two functions equal,
D(Q) = S(Q)
and solving the resulting equation for Q.
Example 7 Find the Equilibrium Point
The supply and demand functions for robotic hamsters are
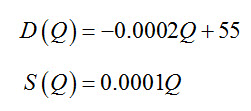
Find and interpret the equilibrium point.
Solution The supply and demand are equal when
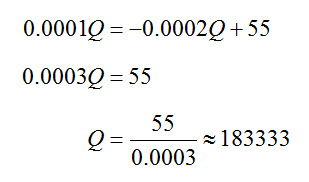
The price at this quantity may be obtained from either function. The equilibrium price is
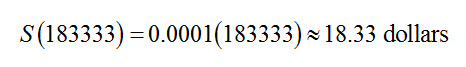
At this price, the quantity demanded by consumers and the quantity manufacturers are willig to supply is approximately 183,333 robotic hamsters.
Businesses operate by obtaining money by the sales of goods and services. The amount of money obtained through the sales of goods and services is called revenue. Revenue is modeled by multiplying the quantity a good or service by the price of each unit of the good or service. We can write this model in mathematical form by writing
revenue = price per unit × quantity
In some situations, the price per quantity may be a constant. For the robotic hamsters, the price per quantity is given by the demand function D(Q). When we substitute the demand function into the revenue relationship, we get the revenue function,
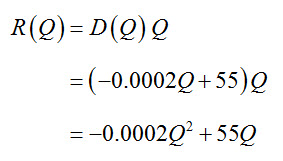
R(Q) = D(Q) Q
We can form this function using the demand function.
Example 8 Revenue Function
The demand function for robotic hamsters is
![]()
a. Use function notation to define the revenue function for this application as a function of the quantity Q.
Solution We need to write a revenue function, R as a function of Q, R(Q). Using the revenue relationship, we find
b. Use the function from part a to determine the revenue when 15,000 robotic hamsters are produced and sold.
Solution The revenue at Q = 15,000 is
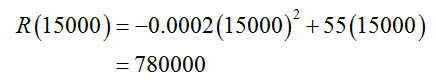
Since the demand function returns a price in dollars per unit and the quantity is in units, the product is in dollars. The revenue from 15,000 robotic hamsters is $780,000.
The revenue function in Example 8 is an example of a quadratic function. Quadratic functions include a term in which the variable is squared. This makes them different from a linear function that contains constants and terms where the variable is raised to the first power.
Any equation that can be written in the form
y = ax2 + bx + c
is a quadratic function. In this form, we say that y is a quadratic function of x. The letters a, b, and c are real numbers corresponding to constants and x and y are variables. In addition, a must not equal zero.
The graph of a quadratic function is a parabola. If a > 0, the parabola has a low point on it. If a < 0, the parabola has a high point. The x value of the low or high point is![]()
We can use quadratic functions to model other economic functions like profit.
The name of a function is arbitrary, but care needs to be taken so that names are not confusing. Quantities beginning with the letter p are especially problematic. Two different economic quantities begin with the letter p, price and profit. To distinguish between them, we’ll need to name them carefully.
Profit is the difference between revenue and cost. We can write this mathematically as
profit = revenue – cost
If the amount received from sales is greater than the cost, the profit is positive since the revenue is greater than the cost. On the other hand, if the costs are greater than the revenue, the profit is negative.
To name a profit function with an independent variable Q, we might want to write P(Q). Although this is perfectly acceptable, the name P might be confused with the variable P representing price. To avoid this confusion, it would be wise to use the name Profit(Q). This function takes the quantity Q of some good or service and outputs the profit at that production level.
If a word is used to name a function instead of simply a letter, we should probably continue this pattern with other related function. Instead of R(Q) for the revenue function, we could use the name Revenue(Q). Instead of C(Q) for the cost function, we could use the name Cost(Q). The names are very descriptive of exactly what the function does and allow us to write the relationship between these functions as
Profit(Q) = Revenue(Q) – Cost(Q)
The name of a function is up to the user. Some textbooks might choose to use an entire world while others might use a single letter. We’ll use both naming conventions so you get used to them.
Once we have the revenue, cost, and profit functions, it is natural to ask at what production level does the company break-even? We can think of the break-even point in one of two ways. First, a company breaks even when the revenue it takes in is equal to its costs. Alternatively, we could also find where the profit function is equal to zero.
Example 9 Profit Function
The cost of producing robotic hamsters at an Asian manufacturing plant is
Cost(Q) = 5Q + 750000 dollars
where Q is the number of robotic hamsters. The revenue from selling the toys is
Revenue(Q) = -0.0002Q2 + 55Q dollars.
a. Find the profit function.
Solution The profit function is formed by subtracting Cost(Q) from Revenue(Q),
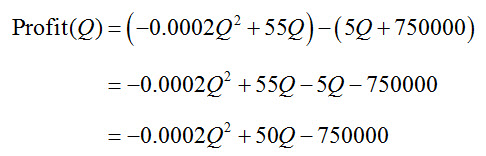
This function is a quadratic function of Q with a = -0.0002, b = 50, and c = -750000.
b. Find the profit at a production level of 100,000 robotic hamsters.
Solution Substitute Q equal to 100,000 into the profit function, Profit(Q) = -0.0002Q2 + 50Q -750,000, to yield
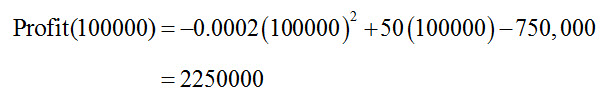
At a production level of 100,000 robotic hamsters, the profit is $2,250,000.
c. Find the break-even quantity.
Solution We have two options for finding the break-even quantity. Set the revenue equal to the cost function and solve for Q or set the profit function equal to zero. If we set the revenue equal to the cost,
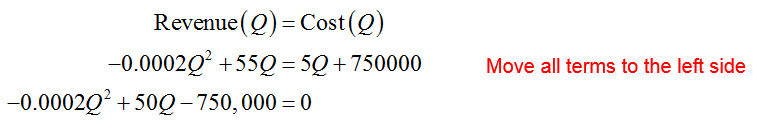
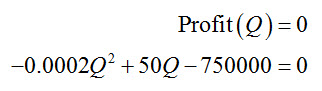
Notice that moving all terms to the left side is the same as setting the profit function equal to zero,
We could try to factor this quadratic equation to solve it, but it is easier to use the quadratic formula:
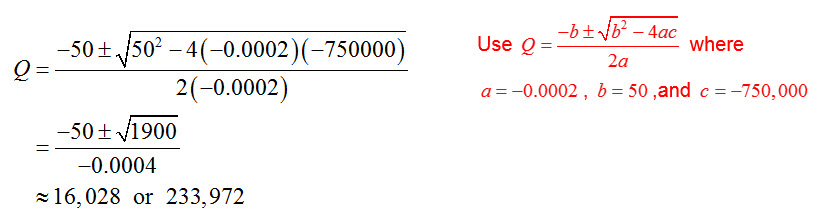
Each quantity occurs at a decimal value. To insure we have at least broken even, round each quantity to the nearest integer so that profit is slightly positive.
d. Does the profit function have a high point or low point? Where is this point?
Solution For this parabola, a < 0. This mean the graph has a high point. Since the independent variable in this problem is Q, the high point is located using the formula ![]() .
.
This gives us a production level of
To locate this point, we also need to find the profit at the break-even quantity. Putting this production level into the profit function yields
In later chapters we’ll learn how to find the high and low points on any function using calculus. Finding these points is one of the useful applications for calculus.