
How do you evaluate a limit at infinity using a table or graph?
Another type of limit is a limit at infinity. One example is
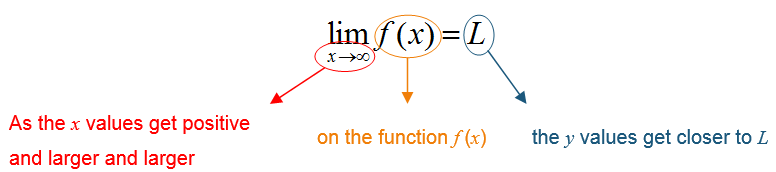
It is called a limit at infinity because x is written as approaching infinity. Instead of getting closer and closer to a fixed point, the x values get larger and larger. In this case, we find that the farther to the right we move on the graph, the closer the the y values get to the value L. If the limit at infinity is L, the graph of the function f (x) has a horizontal asymptote.
If the y values get very large (negative or positive) as we move to the right on the graph, then the limit does not exist.
Example 1 Find the Limit from a Table
Use a table to evaluate the limit 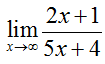 .
.
Solution To get an idea how the y values behave as x gets large, make a table.

To five decimal places, the y values get closer and closer to 0.40000. Therefore,
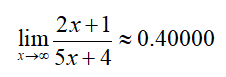
Since this limit exists and is equal to 0.40000, the graph of the function has a horizontal asymptote at y = 0.40000.
Example 2 Find the Limit Graphically
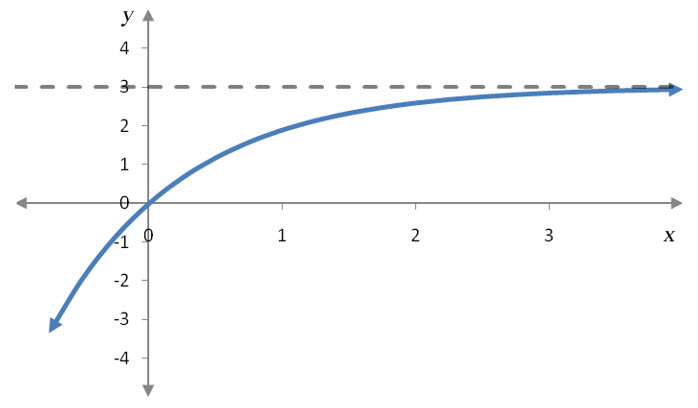
Suppose f (x) is given by the graph below.
Evaluate each of the limits below.
a. ![]()
Solution To evaluate this limit, we need to examine y values on the graph as x gets larger and larger.
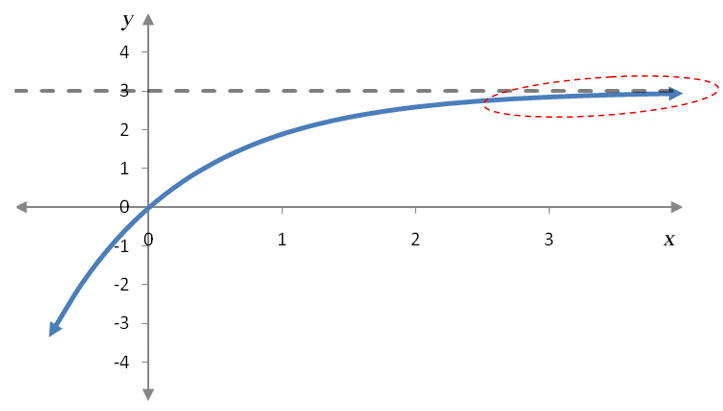
The horizontal asymptote indicates that the graph gets closer and closer to the horizontal line. Let’s locate an x value and its corresponding y value.
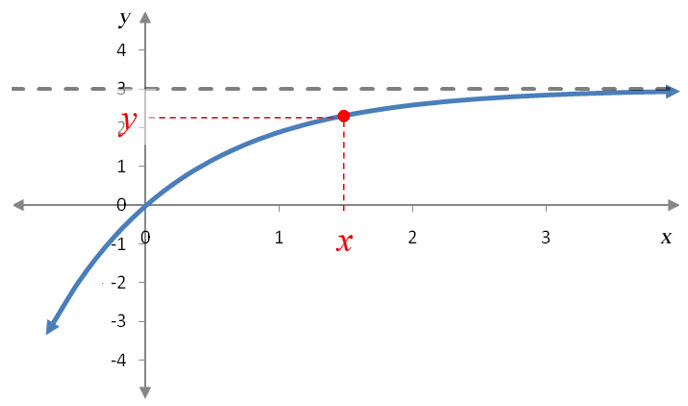
Notice that as x values grow larger, the corresponding y value moves vertically closer and closer to 3. In fact, the more the point moves to the right, the closer it gets vertically to y = 3. This tells us that
![]() b.
b. ![]()
Solution For a limit where x approaches -∞, we let the x values be negative, but larger and larger.
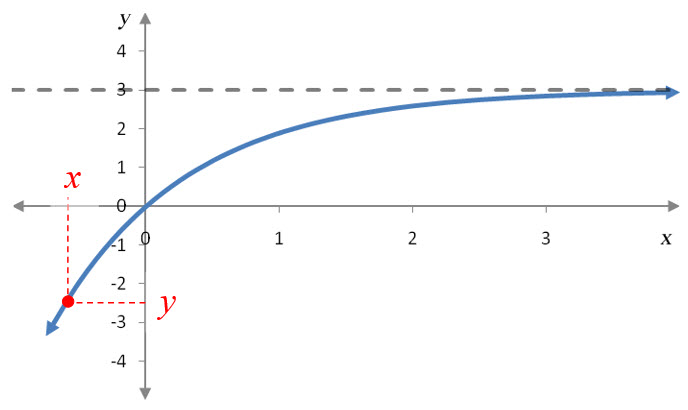
As we move farther and farther to the left on the graph, the corresponding point on the function drops down. This means the y values are dropping and not approaching a fixed value. The limit does not exist. Since the limit does not exist by becoming more and more negative, we write
![]()
If the y values were to become more and more positive because the point rises as we move farther to the left or right, we would similarly conclude that the limit did not exist and then use ∞ to indicate how the function values are growing.
For polynomials and other types of functions, we can use the end behavior of the graph to evaluate the limit at infinity.
Example 3 Evaluate the Limit
Evaluate the limit ![]() .
.
Solution We can use a table or graph to evaluate this limit. Let’s examine both to insure they give a consistent value for the limit.

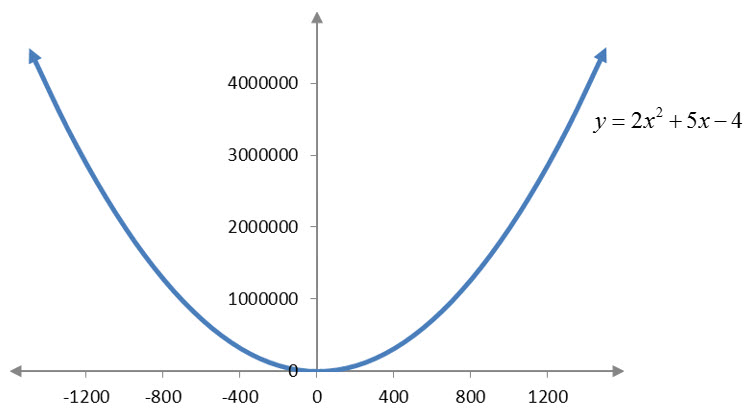
For x values more and more negative (farther and farther to the left on the graph), the y values grow larger and larger. The y values are not approaching any value so the limit does not exist,
![]()