
What does the second derivative of a function tell you about a function?
The first derivative of a function tells us the rate at which a function changes. If the first derivative is positive over some interval, then the values on the function are increasing as we move left to right over the interval. If the first derivative is negative over some interval, then the values on the function are decreasing as we move left to right over the interval.
The relationship between a function and its derivative is always the same. The derivative tells you whether the function it comes from is increasing or decreasing. If the function we are examining is the first derivative itself, the second derivative tells you whether the first derivative is increasing or decreasing. The curvature of the graph of a function is influenced by whether the first derivative is increasing or decreasing.
A graph is concave up over an interval [a, b] if the graph is above its tangent lines at each point in the interval.
A graph is concave down over an interval [a, b] if the graph is below its tangent lines at each point in the interval.
Let’s examine a specific function, f (x) = x3 – 12x2 + 37x, to see how the concavity of a graph is related to the second derivative of f (x).
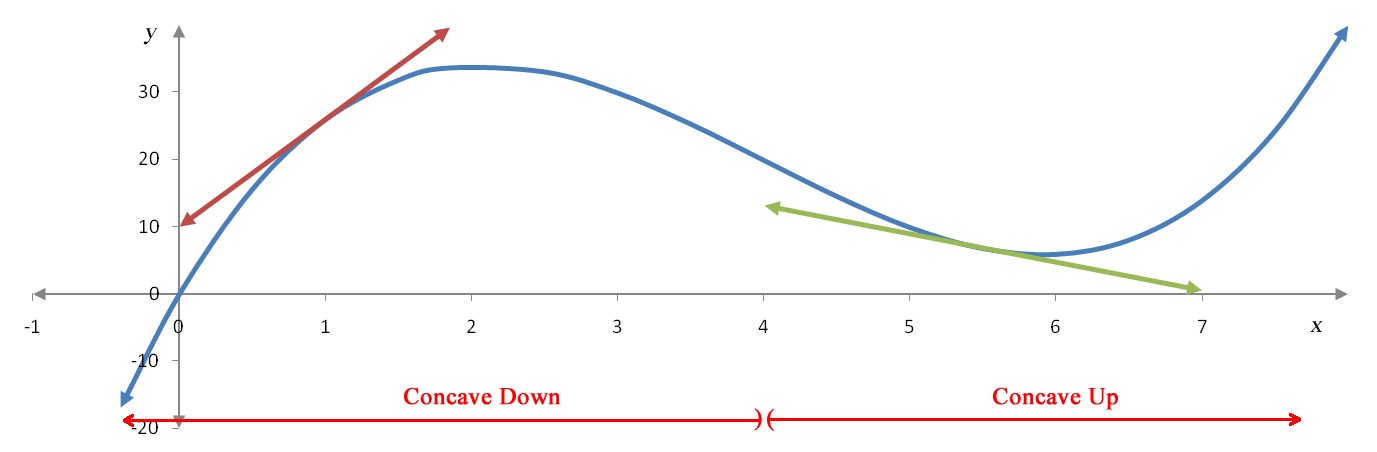
Figure 2 – A graph of y = f (x) with two tangent lines.
In Figure 2, any point on the graph to the left of x = 4 such as the point at x = 1 is below its tangent line so the graph is concave down over the interval (-∞, 4). Any points to the right of x = 4, such as x = 5.5, are above the corresponding tangent line so the graph is concave up over the interval (4, ∞). Informally, the graph bends downward when the graph is concave down and bends upward when the graph is concave up.
The function’s values locate the heights of the points on the graph. Over the x values listed in the table, all y values are positive so the function is graphed above the x axis at those x values.
The first derivative values indicate where the function is increasing or decreasing. When the first derivative is positive, the function’s graph is increasing. When the first derivative is negative, the function’s graph is decreasing.

The values of the second derivative indicate where the function’s graph is concave up or concave down. When the second derivative is negative, the function’s graph is concave down. When the second derivative is positive, the function’s graph is concave up.
We can understand this behavior by examining how the first derivative is changing in the table.
To the left of x = 4, the first derivative values change from 16 to -8. Since the first derivative values are decreasing, the derivative of the first derivative, the second derivative, must be negative to the left of x = 4.
To the right of x = 4, the first derivative values change from -8 to 16. Since the first derivative values are increasing, the second derivative, must be positive to the left of x = 4.
Concavity and the Second Derivative
When the graph of a function f (x) is concave up, the second derivative f ″(x) is positive.
When the graph of a function f (x) is concave down, the second derivative f ″(x) is negative.
The points on the function where the function changes concavity, concave down to concave up or concave up to concave down, are called points of inflection. We can use a process, similar to how we tracked the sign of the first derivative, to track the sign of the second derivative. This process allows us to determine where a function’s graph is concave up or concave down and the location of any inflection points.
Example 6 Determine Concavity
Let f (x) be the function defined by
![]()
a. Where is the function f (x) concave up?
Solution The concavity of a function can be determined from the second derivative of a function. For this function, the first derivative is
![]()
and the second derivative is
![]()
The function f (x) is concave up when the second derivative is positive. We can use a number line, in a manner similar to how we tracked the sign of the first derivative, to track the behavior of the second derivative. Start by locating where the second derivative f ″(x) is equal to zero or undefined:
There are no values where the second derivative is undefined. This x value is where the second derivative could potentially change sign. By testing the second derivative on either side of x = 1, we can decide where the second derivative is positive and where it is negative.
Start the second derivative number line by labeling x = 1 on it with the behavior of the second derivative above that label.
Test x = 0 and x = 2 in the second derivative so that we can label the corresponding signs on the number line.
We can add this information to the number line.
Since the second derivative is positive on the right side of x = 1, the function is concave up on the interval [1, ∞).
b. Where is the point of inflection on the function f (x)?
Solution The number line from part a indicates that the concavity changes from down to up at x = 1. The corresponding y value is calculated from the original function,
![]()
This point, (1, -2) , is the point of inflection.
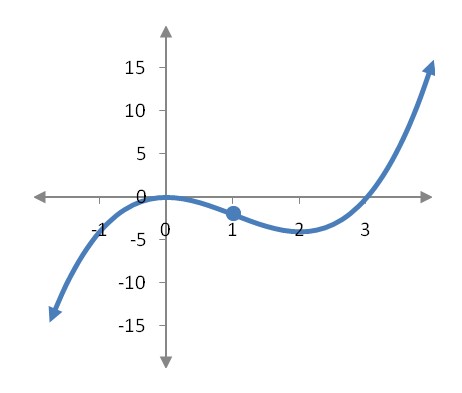
Figure 3 – The point of inflection at (1, -2) is where the concavity of the function changes.
Example 7 Find the Point of Inflection
Companies like Apple spend money on research and development to help them develop new products. Products like Ipods, Iphones and Ipads all started with an investment in research and development and now are a large portion of Apple’s sales. From 2001 through 2010, sales S(R) (in billions of dollars) are related to research and development expenditures R (in billions of dollars) via the function
![]()
(Source:Modeled from Apple Annual Reports)
a. Find the point of inflection.
Solution To find the point of inflection, we must find any points where S″(R) is equal to zero or undefined. Once we have located these points, we can test the second derivative on either side of these values to see if the concavity changes.
The first derivative of S(R) is
![]()
By taking another derivative of the first derivative, we get the second derivative
![]()
The second derivative is always defined, so the only values where the concavity might change correspond to S″(R):
This value is approximately equal to 1.058 billion dollars of research and development expenditures. The concavity may or may not change at this value of R. To check the concavity on either side of R ≈ 1.058, make a number line for reasonable values of research and development expenditures. Test the second derivative on either side of the potential point of inflection.
The function S(R) is concave down on the left side of R ≈ 1.058 and concave up on the right side of R ≈ 1.058. Since the concavity changes, this value corresponds to a point of inflection. The point is located on the graph by substituting 1.058 in the original function,
This point, (1.058, 32.426), is also the location of the point of inflection.
b. What does the point of inflection tell you about the relationship between sales and research and development expenditures?
Solution Let’s examine the graph of the sales function S(R).
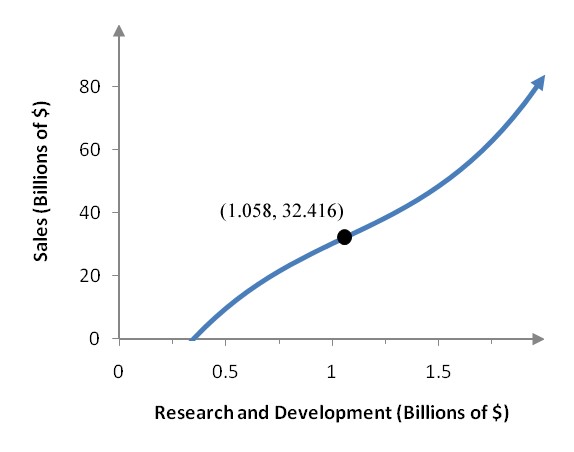
Figure 4 – The sales at Apple as a function of research and development spending.
This function is increasing throughout its domain indicating that as research and development increases, sales increase. When research and development spending less than 1.058 billion dollars, increasing spending leads to higher sales but at a reduced rate. This is because the slope of the sales function is getting smaller as we increase R in the interval [0, 1.058). Once research and development spending is greater than 1.058 billion, increased spending leads to greater and greater sales. This is because the slope of the sales function is getting higher as we increase R in the interval (1.058, ∞).
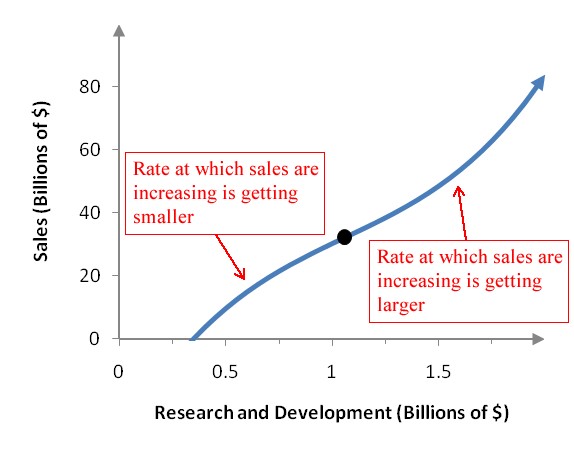
Figure 5 – Increasing research and development spending beyond 1.058 billion dollars leads to greater and greater sales.
Example 8 Find the Point of Inflection
Wireless companies like Verizon Wireless are able to increase their revenue by adding more subscribers. However, as the number of subscribers is increased, the amount charged often decreases to attract customers from competing wireless companies. For the years 2004 through 2009, the service revenue R(S) (in millions of dollars) as a function of the number of subscribers S (in millions of subscribers) can be modeled by the function
![]()
(Source: Modeled from data in Verizon Annual Reports)
Find the point of inflection.
Solution To find the point of inflection, we need to calculate the first derivative,
![]()
and the second derivative,
![]()
The graph might change concavity where the second derivative is equal to zero or undefined. Since the second derivative is a linear function, it is defined everywhere. Set the second derivative equal to zero and solve for S to find where R″(S):
The fraction ![]() is approximately 57.8. Let’s make a number line for the second derivative R″(S) and track the sign of the second derivative on the interval [0, ∞). Two useful second derivative values are
is approximately 57.8. Let’s make a number line for the second derivative R″(S) and track the sign of the second derivative on the interval [0, ∞). Two useful second derivative values are
Label these values on a second derivative number line.
The service revenue function is concave up for values less than 57.8 million subscribers and concave down for values greater than 57.8 million subscribers. The service revenue at this number of subscribers is
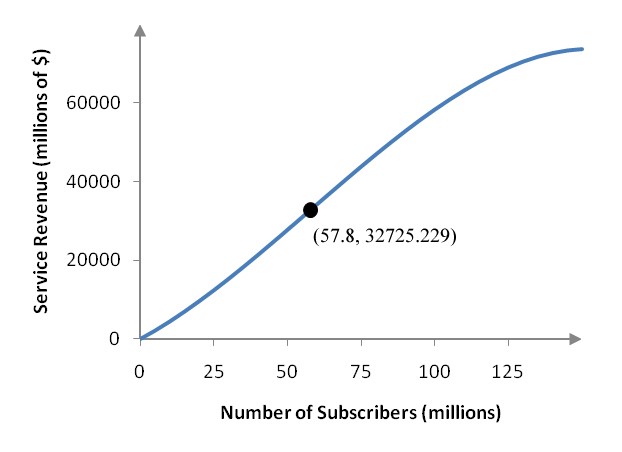
Figure 6 – A graph of R(S) with the point of inflection.
When the number of subscribers is less than 57.8 million, adding subscribers leads to more and more revenue since the slope of the function is getting larger. However, once 57.8 million subscribers is exceeded, the service revenue continues to increase but at a smaller and smaller rate since the graph gets less steep. The point of inflection is the dividing line between where the rate of change of service revenue gets larger and larger or smaller and smaller.