
Graphical Linear Programming
Systems of inequalities constrain the values of the variables that are reasonable for a problem. For example, in the craft brewery problem in Section 4.1, the system of inequalities defined a region on a graph that told us how many barrels of pale ale and porter that could be produced. The ordered pairs on the graph insured that the brewery does not exceed monthly production or exceed their ability to ship, store, and process malt and hops.
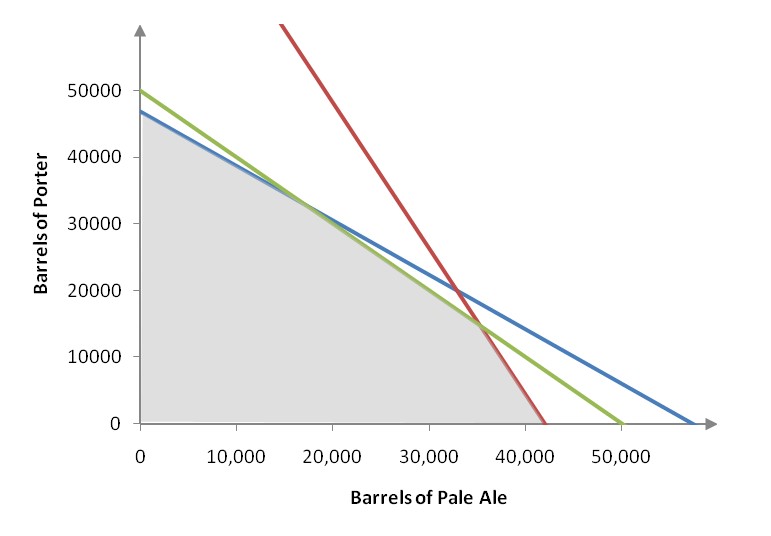
Figure 1 – The shaded area of the graph represents possible solutions to the system of inequalities for the craft brewery.
There are an infinite number of combinations on the graph that make all of the inequalities in the system true at the same time. Which of these solutions is the best for the brewery to produce? How do we pick out the optimal production level for each type of beer? These questions can be solved by posing a linear programming problem. By solving the linear programming problem, we find the production level for beer that meets some criteria and satisfies the constraints given by the system of inequalities.
Read in Section 4.2
Section 4.2 Workbook (PDF) – 10/8/19
Watch Videos

Applications
Read in Section 4.2