
A stock brokerage is grading its trainees by evaluating their stock picks over a 6 month period. The company has analyzed the trainees’ stock portfolios and computer usage to determine that 60% of the stocks picked by the trainees were up in the 6 month period and 45% of the trainees do research on their stock picks. In addition, the brokerage determined that of the stocks that were up, 30 of the trainees picking a particular stock did research on the stock and 30 of the trainees picking a particular stock did not do any research on the stock.

If a trainee buys the stock of a company they have researched, what is the likelihood that the stock was up over the 6 month period?
Before we start calculating haphazardly, let’s define two events for the problem:
S is the event that a stock that was picked by a trainee was up
R is the event that a trainee did research on a stock that they picked
In terms of these events, we need to find the probability P(S | R), the probability that a stock picked by a trainee was up, given that that stock pick was researched by the trainee. Now let’s examine the information in the problem statement.
The statement says, “60% of the stocks picked by the trainees were up in the 6 month period.” This information is given as a percentage so it corresponds to an empirical probability. In terms of the event S, it tells us that
P(S) = 0.60
The statement also says, “45% of the trainees do research on their stock picks.” This information relates to the event R and tells us that
P(R) = 0.45
The statement “the brokerage determined that of the stocks that were up, 30 of the trainees picking a particular stock did research on the stock and 30 of the trainees picking a particular stock did not do any research on the stock” relates the events S and R. By saying that “of the stocks that were up”, we are establishing that the following information corresponds only to stocks picked by the trainees that are up or that the information matches a conditional probability where we are given S. Additionally, we know that a total of 60 trainees picked stocks that were up since of the stocks that were up, 30 trainees did research and 30 did not do research. Based on this information,
On a tree diagram, we can label the branches as shown.
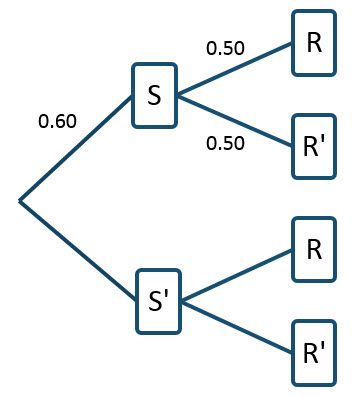
For this particular way of constructing the tree diagram, the probability P(R) = 0.45 cannot be labeled on the diagram directly. Remember, we are looking for P(S | R) which is NOT the same as the probability P(R | S) = 0.5. To relate these conditional probabilities, utilize Bayes’ Rule in the form,
![]()
Solving for P(S | R), we get
Each of the probabilities on the right side we have already found and can be substituted to yield
This number does not have much meaning unless we compare it to the likelihood of picking a stock that is up, given that the trainee did not do any research on the stock, . Using Bayes’ Rule in this case yields
The only probability that we have not calculated is P(R′). Using the compliment rule, this is easily calculated as
Now we can return to Bayes’ Rule to calculate
In summary, we now know that
Now we can compare these two probabilities to draw conclusions about the events. Based on these numbers, we see that it is more likely that a stock chosen by a trainee goes up provided the do research. The probabilities P(S ′ | R) and P(S ′ | R′) can be found with similar versions of Bayes’ Rule.