
When a rate N ´(t) is given by the function’s formula, we can undo the rate by taking the antiderivative of N ´(t) to get N(t). The approach is not so clear cut if the function is given only by a graph. We could try to determine the formula for the function’s graph. This could be tedious and result in an estimate if we cannot find the formula perfectly. In this case, we might simply try to find the area geometrically.
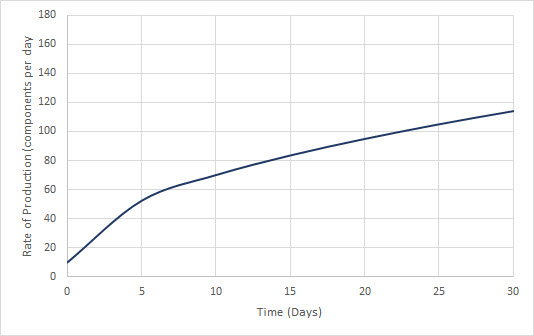
Suppose the graph above gives the average rate at which new employees produce electronics components (in components per day) as a function of the number days of on the job training. As you might expect, employees initially produce a low number of components per day and produce more components per day as the training goes on (moves to the right on the graph).
Estimate the number of components produced by a new employee over the first 30 days of training.
Since we are given the rate in components per day, we need to find the area under the function from 0 days to 30 days to find the estimate. Let’s estimate the area using left and right hand estimates where each rectangle is 5 days wide.
Let’s start with a left hand estimate. The base of the first rectangle must extend from 0 to 5 days. Since we need this rectangle to touch the curve on the left hand side, it must look like the one below.
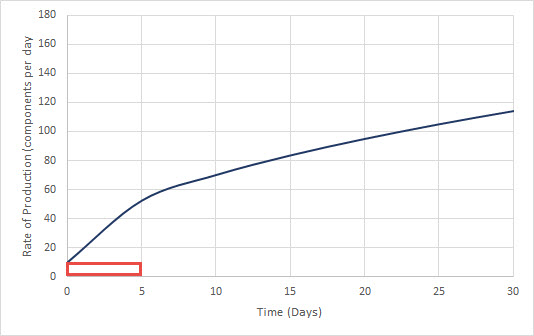
If the function were given by a formula, we could use that formula to get the height of the rectangle at 0 days. Since we do not have a formula, we can use the scale along the vertical axis to estimate the height as 10 components per day. This means the area of this rectangle is
(10 components per day)(5 days) = 50 components
This means that on average the worker would produce 50 components over the first five days (as a left hand estimate). If we continue constructing rectangles of width 5 from 0 days to 5 days, we get the graph below.
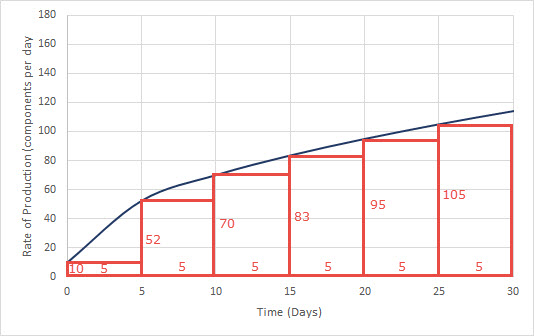
The sum of these areas is
LHS = (10)(5)+(52)(5)+(70)(5)+(83)(5)+(95)(5)+(105)(5) = 2075
If we follow the same procedure with rectangles that touch the function on the right of the rectangle, we get the rectangles below.
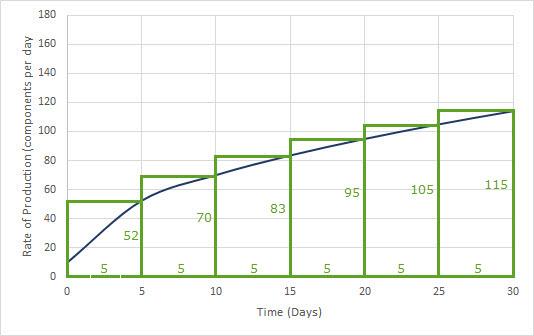
The sum of these rectangles is
RHS = (52)(5)+(70)(5)+(83)(5)+(95)(5)+(105)(5)+(115)(5) = 2600
Based on these estimates, the number of components produced in 30 days is between 2075 and 2600.
If we want these estimates closer together, we would to reduce the width of the rectangles (increase the number of rectangles). If the rectangles were 2.5 days wide (12 rectangles), we would expect the estimates be be about half as close. If the estimates are needed to be that close, then we could carry out the calculation with 12 rectangles.