Any function is graphed with a few basic steps.
- Put the function into the calculator.
- Set the graphing window.
- Graph the function.
The exact sequence of steps is demonstrated in the handout below.
Any function is graphed with a few basic steps.
The exact sequence of steps is demonstrated in the handout below.
Excel may be used to create tables of values for function at equally spaced inputs or at input that are not equally spaced.
A table at equally spaced inputs is useful for creating a graph. The handout below shows how to do this in Excel 2007. The process is almost identical in other versions of Excel.
We can make a table at arbitrary input also. The handout below demonstrates this process. This is very useful for evaluating limits in calculus.
Finding a linear model when the data does not follow a perfectly straight line may be referred to by several terms. The terms “method of least squares”, “linear regression”, or “best fit” are all used to refer to modeling data with lines.
We can also use WolframAlpha to model data with lines. To do this we type “linear fit” followed by the data listed as ordered pairs. Here is an example.

You get a graph, the model, and R squared values when you execute this command.
A matrix is entered between curly brackets in WolframAlpha (http://www.wolframalpha.com). Additionally, each row of the matrix is entered in curly brackets too.
You can also put a matrix in reduced row echelon form. We could put the augmented matrix
$latex \displaystyle \left[ \begin{array}{*{35}{l}}
1 & 2 & -1 \\
4 & 3 & 1 \\
\end{array} \right]$
Use the text “row reduce” and then enter the matrix. The solution is x = 1 and y = -1.
Let’s try this with another system of linear equations
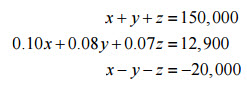
Convert this system into a 3 x 4 augmented matrix:
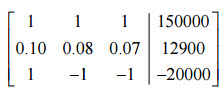
WolframAlpha understands several commands for putting an augmented matrix into reduced row echelon form. You can use the command rref { }or the command row reduce { }. The matrix goes inside the curly brackets. However, the matrix must be put in carefully. Each row needs to be typed in inside of curly brackets with the entries separated by a commas. In this case, you would type
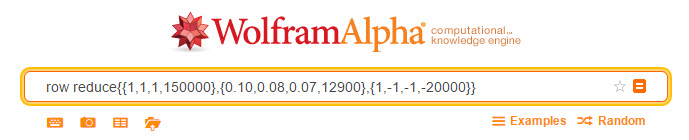
on the command line in WolframAlpha.
After you press Enter, the reduced row echelon form is computed,
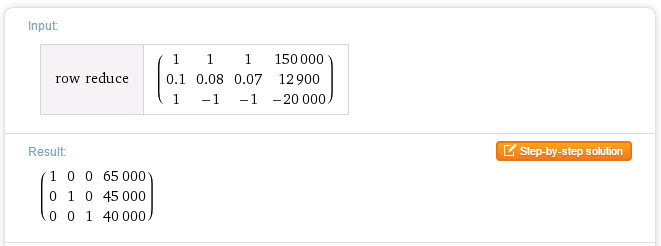
This indicates that the solution to the system is
x = 65,000, y = 45,000, z = 40,000.
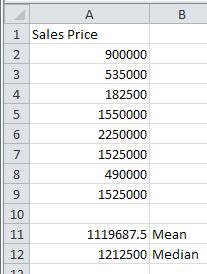
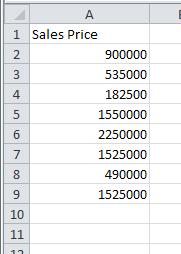
During the week of 6/7/2012 through 6/14/2012, eight homes were sold in Paradise Valley, Arizona in the area code 85253. The sales prices for these homes are listed below.
900,000
535,000
182,500
1,550,000
2,250,000
1,525,000
490,000
1,525,000
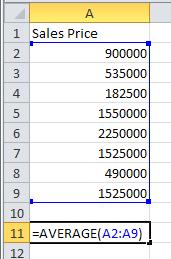
a. Find the mean sales price.
Solution Use the AVERAGE command to compute the mean of the data.
2. Click on cell A11. This is where we will place the mean of the data. Type =AVERAGE( as shown to the right. The command will be shown in the cell as well as the function bar. To indicate the location of the data, type A2:A9. You can also click in cell A2, hold the left mouse button down and drag the cursor to cell A9. Type ) to complete the command.
Press Enter to compute the mean. In cell B11, type Mean to identify the type of central tendency.
b. Find the median sales price.
Solution Use the MEDIAN command to compute the median of the data.
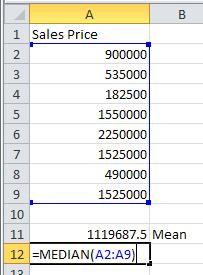
3. Press Enter to compute the median.
4. In cell B12, type Median to identify the measure of central tendency.