Which linear model is best?
In real life, data are not so perfect. A more common situation might be the data in Table 1.
Table 1
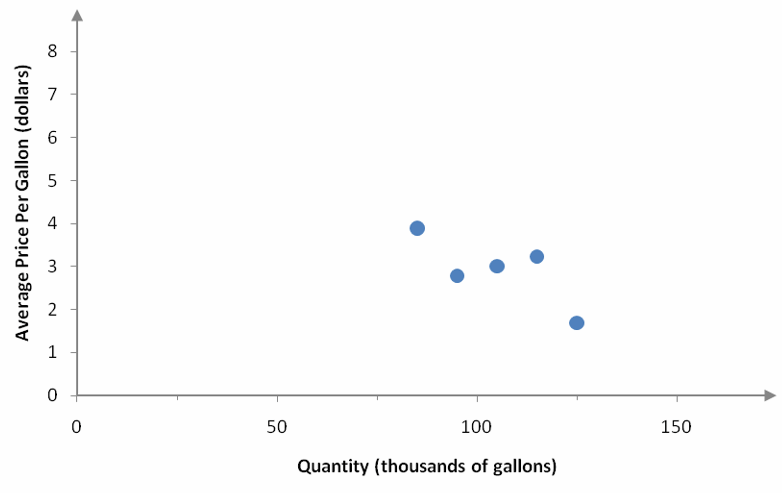
If we were to calculate the slope between adjacent points, we would find that the slope is not constant. This is easy to see if we graph the ordered pairs from the table in a scatter plot.
Figure 2 – A scatter plot of the data in Table 1.
The slope between adjacent ordered pairs is not constant.
Although we cannot find a linear function that passes though all of the points, we can find a linear function that passes close to the points. This function is said to model the data. A mathematical model is a representation of a real world system. In this case, the model is a representation of the relationship between the average price of a gallon of milk and the quantity of milk sold per week.
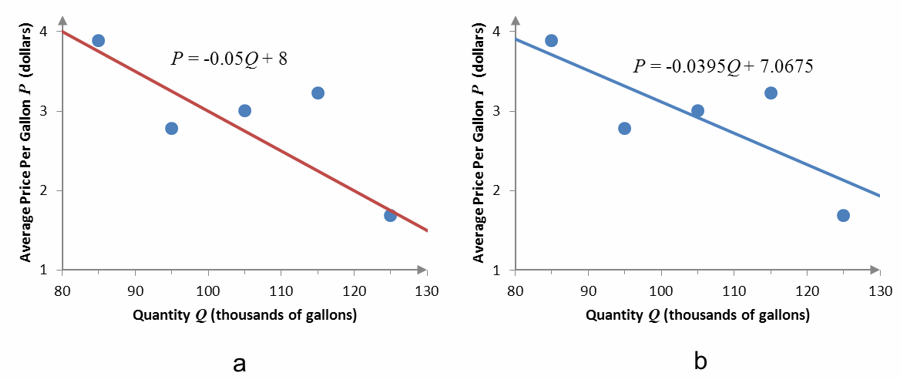
Figure 3 – Two different linear functions that model the relationship between the average price of a gallon of milk and the number of gallons sold at that price.
The linear functions in Figure 3 both pass close to the points, but which function passes “closest” to the points?
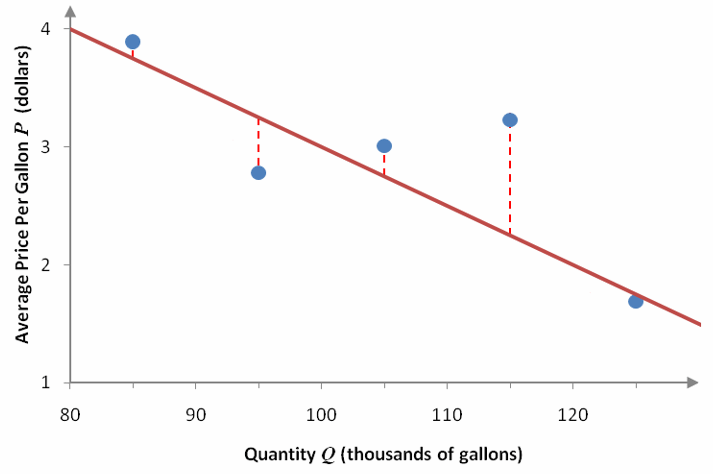
Closeness is measured vertically from the data point to the line. For instance, let’s draw a vertical dashed line from each point to the linear function in Figure 3a.
Figure 4 – The dashed red lines represent the vertical distances between the data values and the linear function.
The vertical distance between any data value and the line can be computed by subtracting the corresponding prices. To find the largest vertical distance at Q = 115, we need to find the average price from the data and from the linear model:
Price at Q = 115 from data: P = 3.23
Price at Q = 115 from linear function:
The symbol indicates that the price has been estimated from the model whereas P indicates a data price. The difference between the data price and the linear model price is called the error or residual. For this price, the error is
Since the error is positive, we know that the data price is higher than the model’s price. If the error is negative, the model’s price is higher than the data price. This is the case at Q = 95:
Price at Q = 95 from data: P = 2.78
Price at Q = 95 from linear function:
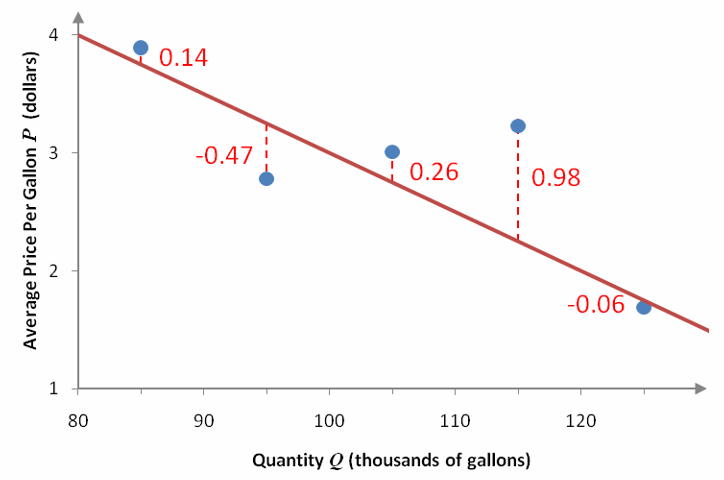
We can carry this process at each of the quantities in Table 1 and label it on a scatter plot.
Figure 5 – A scatter plot of the data and the linear model. The dashed red line and red numbers indicate the error between the data and the model.
If we want a linear function to go as close to the ordered pairs as possible, we need to collectively make these errors as small as possible. This is done by summing the errors at each quantity. If the sum of the errors is zero, the linear function might go through each point.
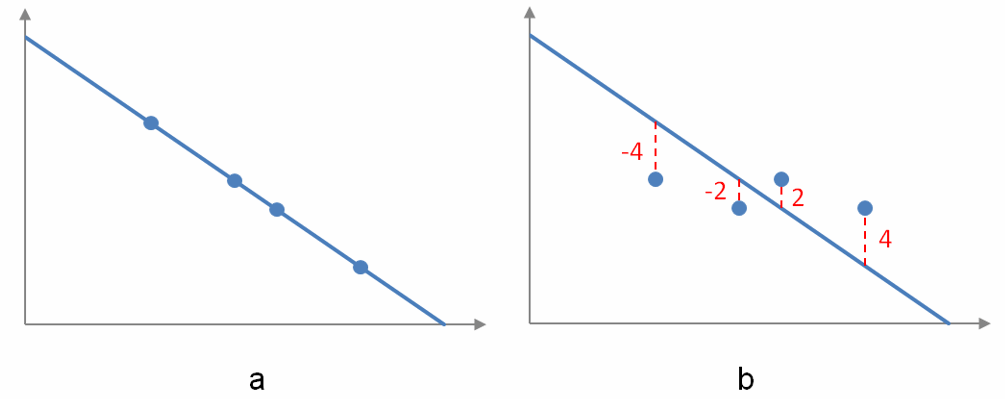
Figure 6 – In a, each data point coincides with the linear model so the sum of the errors is zero. In b, the sum of the errors is also zero, but the data points do not lie on the graph of the linear model.
But we can’t simply sum the errors as is since some of the errors are positive and some are negative. By adding the errors together we might have some cancellation and be deceived into thinking that a linear model coincides with the data when it does not. This situation is illustrated in Figure 6. In graph a of Figure 6, each ordered pair of the data lies on the linear model so there is no error between the model and the data. The sum of the errors is zero. In this case, the linear model fits the data perfectly.
But simply adding the errors is inadequate. In graph b of Figure 6, the sum of the errors is also zero. However the model does not fit the data perfectly. Some ordered pairs are above the linear model and others are below the linear model. For each positive error, there is a negative error that cancels it. Even though the sum is zero, the linear model is not a very good fit for the data.
A better criterion for determining the fit is needed. Instead of simply summing the errors, sum the square of the errors. This eliminates the potential cancellation of the positive and negative errors.
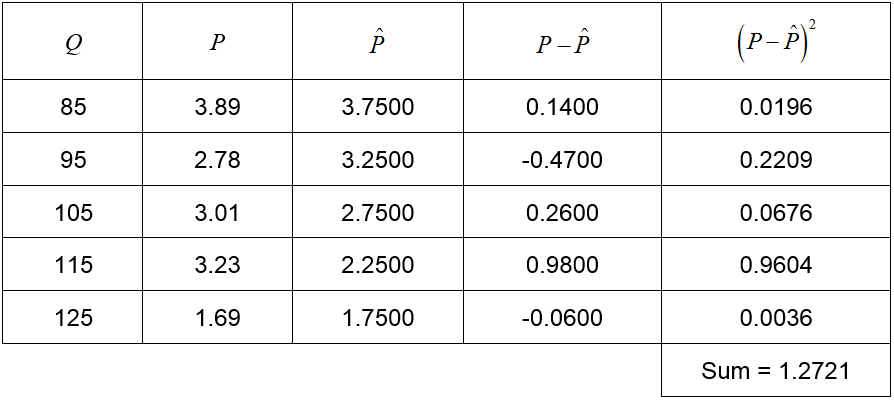
Table 2
In Table 2, the first three columns describe the quantity Q, the price P and the estimate of the price based on the linear model. The fourth column describes the error in the estimate and the last column corresponds to the squared error. For this model, the sum of the squared errors is 1.2721.
A model that has a lower sum of squared error would be considered a better model. Let’s look at the model in Figure 3b, P = -0.0395Q + 7.0675.
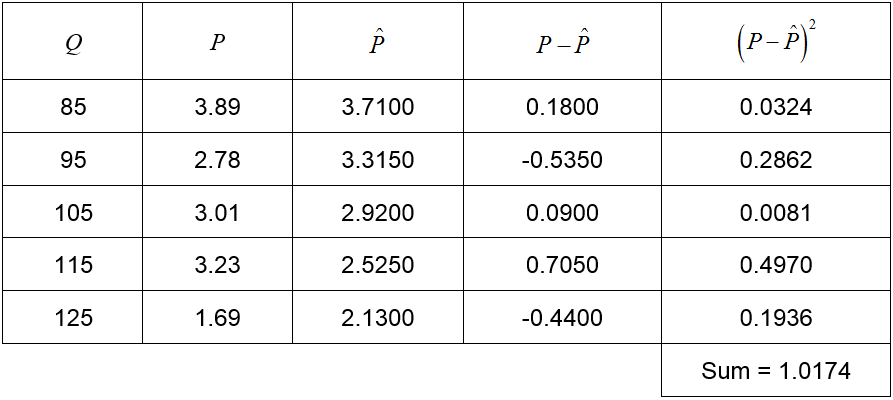
Table 3
This model, rounded to four decimal places, is better since the sum of the squared errors is lower.
The model P = -0.0395Q + 7.0675 in Table 3 is the very best model for the data. This means that it has the lowest sum of squared errors. If we were to vary the slope and intercept in the model, no other combination would lead to a sum lower than 1.0174.
The process of calculating the linear model with the smallest sum of squared errors is called linear regression. The model obtained through linear regression goes by several different names. Best linear model, least squares linear model and best line are all terms that can be used when referring to the model. The model is typically obtained using technology like a graphing calculator or Excel. The formulas required for calculating the slope and intercept of the best linear model without technology uses calculus and are beyond the scope of this text.


