In the example below, we want to look at the inputs and outputs for a function and interpret what they tells us. In both examples, the function is a quadratic function that models the rise and fall of an object thrown in the air.
Example 1 Suppose a ball is thrown into the air has its height (in feet) given by the function
$latex \displaystyle h(t)=6+128t-16{{t}^{2}}$
a. Find h(1) and explain what it means.
b. Find the height of the ball 4 seconds after it is thrown.
c. Test other values of to decide if the ball eventually falls. When does the ball stop climbing?
Suppose 5000 dollars is deposited in an account that earns compound interest that is done annually. If there is 7000 dollars in the account after 2 years, what is the annual interest rate?
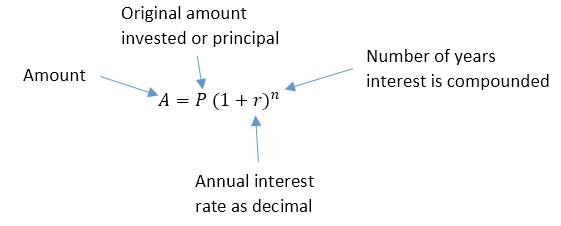
The easiest way to approach this problem is to use the compound interest formula,
This formula applies when interest is earned on an annual basis and the interest is earned once a year.
Let’s look at the quantities in the problem statement:
5000 dollars is deposited in an account > P = 5000
If there is 7000 dollars in the account after 2 years > A = 7000 and n = 2
Putting these values into the formula above gives us
We need to find the annual interest rate r. Since the r is hidden in the parentheses, we start by isolating the parentheses.
To get at the r, we need to remove the square on the parentheses.
Using a calculator to do the square root, we get r ≈ 0.183 or 18.3%.
Note that instead of taking the square root to get rid of the square, we could raise both sides to the 1/2 power:
Then we would be able to solve for r,
and get the same value for r since square rooting and raising to the 1.2 power yield the same result.
Now what if the interest is earned over six years instead of two years? Instead of a square on the parentheses we now have a sixth power. To solve for r in this equation, we follow similar steps as before.
The root can be computed in a graphing calculator using the MATH button, by raising to the 1/6 power (^(1/6)), or put into WolframAlpha:
Either method gives r ≈ 0.577 or 5.77%. Notice that the annual interest is lower when it is earned over a longer period of time.
In many linear application problems, you needed to write the given information as ordered pairs and then find the equation that passes through the ordered pairs. Here is a similar example that use p = mt + b instead of y = mx + b.
Problem The percent of births to teenage mothers that are out of wedlock can be approximated by a linear function. In 1960, the percentage was 15% and in 1996 the percentage was 76%.
Use this information to find a linear model for the percentage of births as a linear function of the number of years since 1950.
Solution Since the problem statement specifies a linear function of the number of years since 1950, the input to this function is years since 1950 and the output is the percentage. The information in the problem can be written as ordered pairs (10, 15) and (46, 76).
Define the variables for these quantities as
t: years since 1950
p: percentage of births to teenage mothers out of wedlock
This means the form of the linear function is p = mt + b. The slope of a line passing through these points is
The slope is written as a fraction so no rounding occurs. Writing this as a decimal and rounding the amount would lead to a line that does not pass through the points. With this slope, we know the equation of the line is . To find the value of b, substitute one of the ordered pairs into the equation and solve for b.
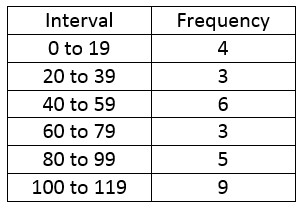
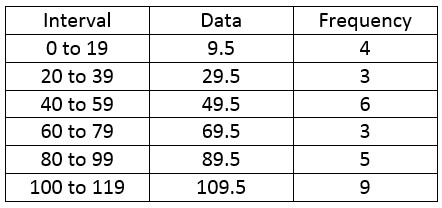
Suppose we are given some frequencies corresponding to some data in intervals.
To find the mean, we need to find a representative data value from each interval.
We’ll use the midpoint of each interval. The midpoint for the first interval is
We can find the other midpoints in a similar manner. Let’s add this to the table.
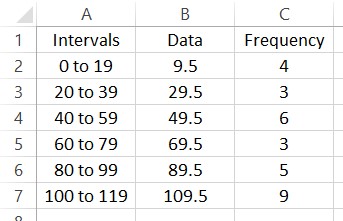
Let’s put this information in a spreadsheet.
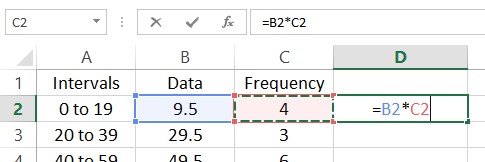
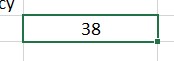
To find the mean of this frequency distribution, multiply each data value times its corresponding frequency. In the spreadsheet, put =B2*C2 in cell D2.
Press Enter to compute this value. Next we need to fill this value into the cells D3 through D7. Click on cell D2. The cell will be outlined like you see below.
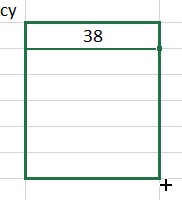
Place your mouse over the box in the lower right hand corner of this outline. The cursor will change to a black cross. Hold down the left mouse button and drag the cursor to cell D7.
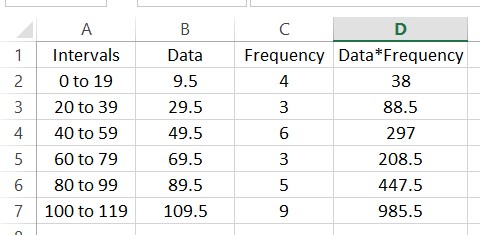
When you release the button, the products will be calculated for each row. Adding a label in cell D1 might help you to remember what the numbers in the cell are.
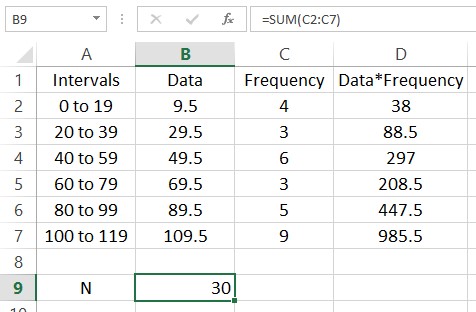
The function SUM is useful for adding up lists of numbers. For instance, we can find the sum of the frequencies N by typing =SUM(C2:C7). Put this formula in cell B9.
In this picture a label has been added in A9 to help the reader understand what is in the cell to the right. Add another label in cell A10 with the text “Mean”. Next to that cell we’ll calculate the mean of the data. This is done by adding the entries in column D and dividing by the sum of the frequencies in cell B9.
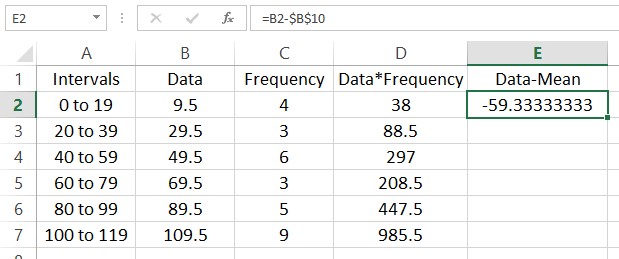
Finding the variance is a bit more complicated. In this calculation we need to subtract the mean from each data value and square the result. This needs to be done with an absolute reference to cell B10 so that the fill always refer to that cell in making the calculation. Start by clicking in cell E2 and typing =B2-$B$10.
This means that the data value 9.5 is approximately 59.3 units below the mean. Fill the rest of the column and we end up with this worksheet.
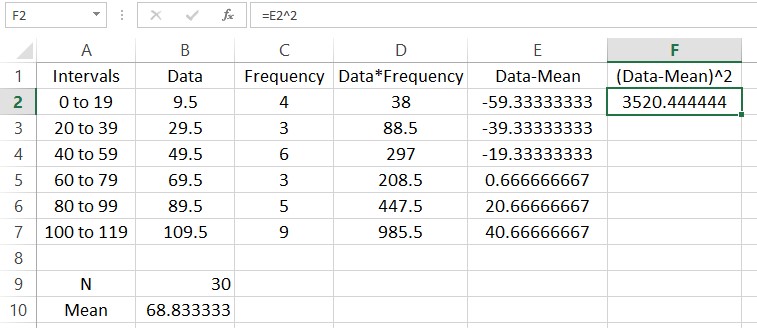
We could sum these deviation now, but the positive and negative nature of each row would mask the spread of the data. Squaring each of the entries makes each of them positive. In cell F2, type =E2^2.
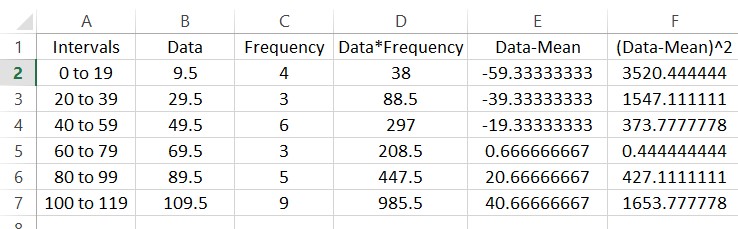
Fill the rest the rows using a fill.
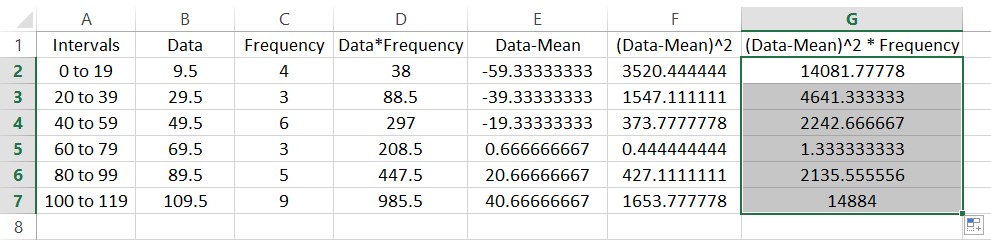
The entries in this column are often called the deviations from the mean squared. Each of these occur with the frequencies in column C. To find the sample variance, multiply the entries in column F by the frequencies in column C to give the worksheet below.
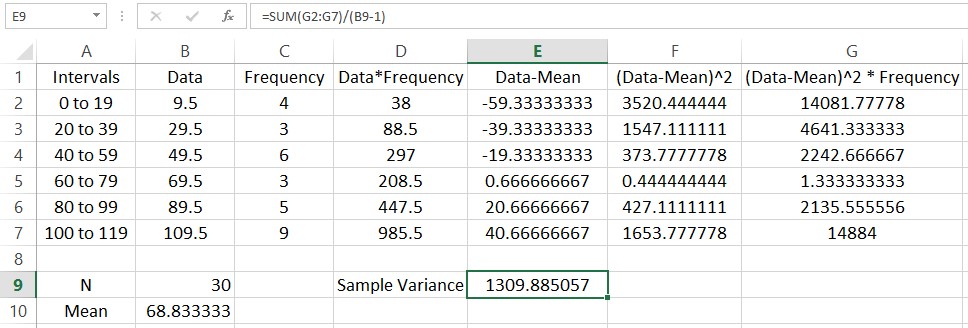
Let’s calculate the variance. Start by typing a label for the sample variance in cell D9. In the adjacent cell we’ll put the value. The variance is the sum of the entries divided by the sum of the frequencies minus 1. In cell E9, type =SUM(G2:G7)/(B9-1).
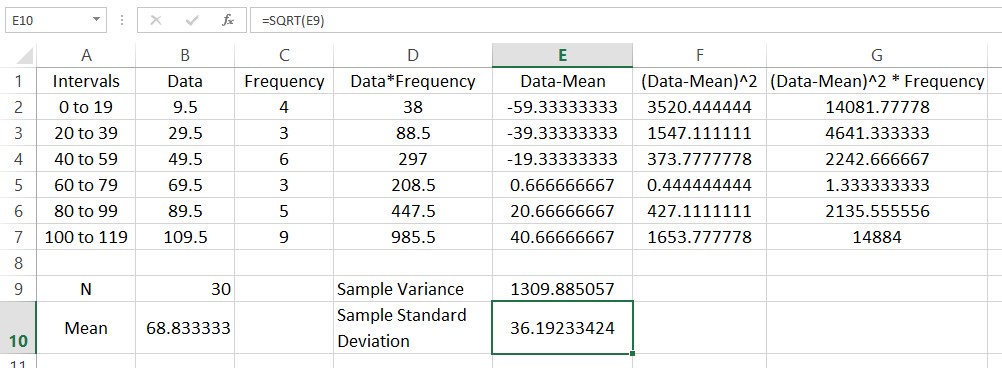
The sample standard deviation is the square root of the standard variance. We can take the square root using the function SQRT. Put a label in cell D10 and type =SQRT(E9) in the adjacent cell.
The standard deviation is a measure of how spread out the frequency distribution is around the mean.