In your classes, you might hear about instructors who grade on “a curve”. There is an idea that this might somehow benefit you when it comes to grading. Let’s take a look how that might work if the curve is a normal curve.
Problem Suppose you and your classmates take an exam that has a mean of 65 and a standard deviation of 4. If the instructor says the top 10% of scores earns an A, what is the cutoff for an A?
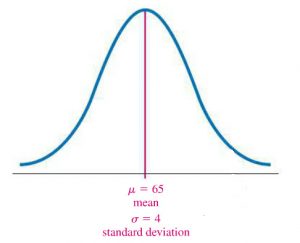
Solution Pictorially, the frequency distribution look like the bell curve below.
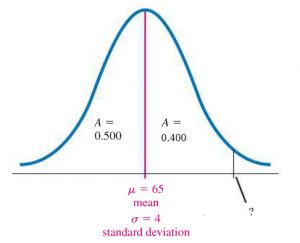
We know that 50% of the test score lie on the left side of the mean so the area on the left side of the mean and under the bell curve is 0.5. Now let’s label a point on the right hand side of the mean where 40% of the scores are from the mean to that point.
At the point labeled by ?, 90% of all scores are below this point (or 10% of scores are above this point).
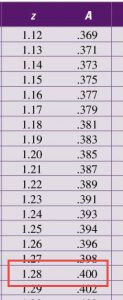
We can locate this point using a table of z-scores and areas. Look for the z score that corresponds to an area of A = 0.4.
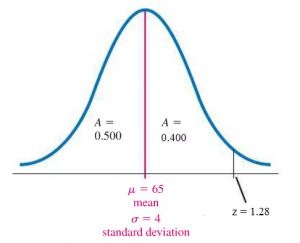
Examining the data, we see that this corresponds to a z-score of 1.28.
But what is the data or raw score that corresponds to a z-score of 1.28?
To find this data value, start with the formula for z-scores,
And put in the values:
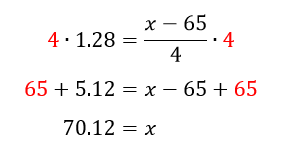
To solve for the data value x, multiply both sides by 4 and then add 65 to both sides.
This tells us that 90% of scores lie below 75.12 and 10% of the scores are above 75.12. To earn an A, you would need to score greater than 75.12.

