What is a function?
A variable is a symbol that represents a quantity that may vary. Typically a variable is a letter of the alphabet. However, not all letters of the alphabet are necessarily variables. For instance, in physics the letter c is a constant that represents the speed of light. It is called a constant because the speed of light in a vacuum does not change. Letters in other alphabets such as the Greek alphabet can also be variables or constants. The letter π (pronounced pi) is a constant used in geometry that has a value that is approximately 3.14157.
Mathematics allows us to describe relationships between quantities in a variety of ways. In your mathematical experience, you have probably been exposed to formulas that relate variables like x and y. There is nothing special about the letters x and y. We could have used any letters in a formula. However, most algebra classes use the variables x and y so we’ll start there and introduce other variables later that are appropriate in finite mathematics.
A very simple formula that relates the variables x and y is
y = 2x
Since this formula is solved for y, you might think of substituting a number in place of x to obtain a value for y. For instance, a value of x = 3 corresponds to a value of y = 6,
We think of this as inputting the value of x = 3 to obtain an output of y = 6. The variable corresponding to the input, x, is called the independent variable. The variable corresponding to the output, y, is the dependent variable. We use the term dependent to emphasize the fact that the value for y depends on the input x. There is nothing special about the letters used in the relationship or even which letter matches with the independent or dependent variables. These terms are used to help describe the input and output from a relationship between two variables. Consider the formula
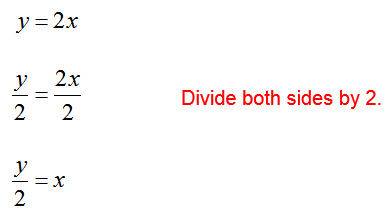
Since this formula is solved for x, we would use it to take a value for y to compute a value for x. In this case we would think of y as the independent variable and x as the dependent variable. This means that an input of y = 6 corresponds to an output of x = 3. These are the exact same values as y = 2x. The reason for this is that it can be solved for x to give :
Whether we start with x and multiply by 2 to get y or start with y and divide by 2 to get x, the relationship between x and y is the same. The only change is our perspective on the independent and dependent variable. In each of these cases, the variable that is solved for is the dependent variable.
The picture gets murkier if the equation is not solved for a variable. Suppose we have the equation
y – 2x = 0
This equation is not solved for x or y. It is not clear whether x or y is the independent variable. In a case like this, we can specify which variable is the independent variable. The choice we make may reflect the quantity the variable represents or may simply be our own personal choice.
If we decide to make the independent variable x, we need to solve the equation for y to yield
y = 2x
In this form, it is easy to input a value for x to calculate an output y. If we decide to make the independent variable y, we need to solve the equation for x to yield
If we have a value for y, this equation can be used to calculate an output x. The variable chosen for the independent variable is often up to the user. In other contexts the independent variable is determined by the traditional choice made by practitioners in the field.
Example 1 Write an Equation with a Specified Independent Variable
Suppose you have the equation 10P + 2Q = 100 relating the quantity Q of a product demanded by consumers and the price P in dollars.
a. Write the equation with P as the independent variable.
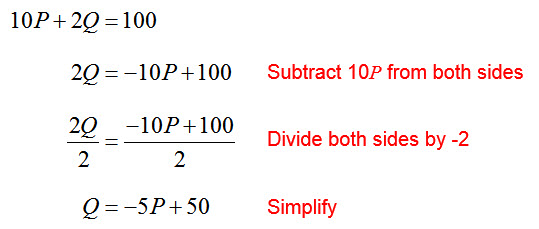
Solution To write 10P + 2Q = 100 with a certain variable as the independent variable, solve the equation for the other variable. If P is to be the independent variable, solve the equation for Q:
b. Write the equation with Q as the independent variable.
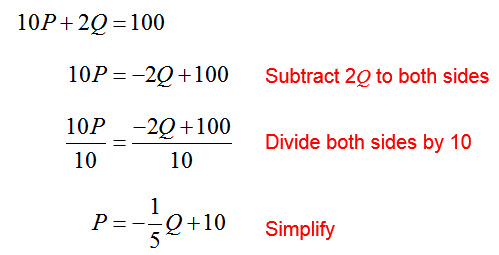
Solution If Q is to be the independent variable, solve the equation for P:
Economists traditionally choose the quantity Q to be the independent variable when working with functions relating price and quantity. In this format, we can see that as the quantity Q demand by consumers increases, the price of the good must decrease to make it attractive to the consumer.
The term function describes a special type of relationship between the independent and dependent variable. These values for these variables are chosen from two sets called the domain and range of the function. The values for the independent variable are chosen from the domain and the values for the dependent variable are chosen from the range.
A function is a correspondence between the independent and dependent variable such that each value of the independent variable corresponds to one value of the dependent variable.
The phrase “a function of” is used to tell the user what the independent variable is. For instance, the phrase “y as a function of x” indicates that the independent variable is x and the dependent variable is y.
To determine if an equation describes a function, identify the independent and dependent variable. Then determine if each value of the independent variable selected from the domain of the correspondence matches with no more than one value of the dependent variable. If there is no more than one match, then the correspondence is a function.
Example 2 Determine If An Equation Represents a Function
Does the equation 10P + Q = 500 describe P as a function of Q?
Solution Since this example specifies P as a function of Q, we know that the independent variable is Q and the dependent variable is P. To make it easier to see how P and Q are linked, solve the equation for the dependent variable P:
In this form, we can see that a value like Q = 100 corresponds to one value of P, P = 40. In fact, for any value of Q you get only one value P. This means that this equation describes a function.
Example 3 Determine If An Equation Represents a Function
Does the equation x2 + y2 = 4 describe y as a function of x?
Solution This example specifies y as a function of x so we know that the independent variable is x and the dependent variable is y. Like the previous example, solve for the dependent variable y:
If we try a value like x = 10, the radicand becomes -102 + 4 or -96. Assuming we are using real numbers, we can’t take the square root of a negative number. The input to this equation is not a reasonable input because it is not a part of the domain of this function.
To be a part of the domain of this function, the input to this function needs to make the radicand nonnegative. The value of x must satisfy –x2 + 4 > 0. Inspecting this inequality, we can see that –x2 + 4 = 0 at x = -2 or 2. Values between -2 and 2 like x = 0 make the expression positive. This means the domain of this relationship is all real numbers greater than or equal to -2, but less than or equal to 2.
If we pick values from the domain like x = 0, we get two outputs, or
. Since there is a number in the domain that corresponds to more than one member of the range, the relationship x2 + y2 = 4 does not describe a function.
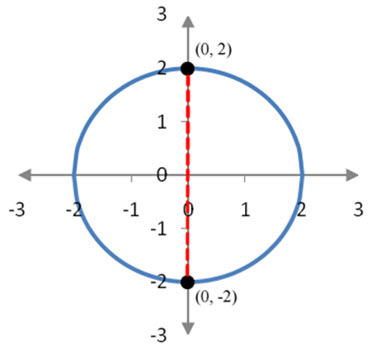
A graph of this equation verifies this conclusion. The graph of this equation is a circle.
Figure 1 – For this graph, any input between x = -2 and x = 2 leads to two outputs. This means the graph does not correspond to a function.
On this circle, we can see that the line x = 0 crosses the graph at the points (0, 2) and (0, -2). This means that the input x = 0 corresponds to two different outputs. In fact, any input except for x = 2 or x = -2 corresponds to two outputs since vertical lines cross the graph in two places.
In Example 2, we found that by writing 10P + Q = 500 in the form we could easily check to see if each value of Q led to no more than one value of P. This told us that this relationship was a function since each value of the independent variable led to no more than one value of the dependent variable. Now let’s look at this function a little closer.
You may have thought that the variables P and Q were a bit strange. After all, in most math textbooks you typically work with the variables x and y. In these situations you were working with equations and their corresponding graphs in the x–y plane. You were most concerned with the shapes of these graphs and the equations usually had little basis in an application.
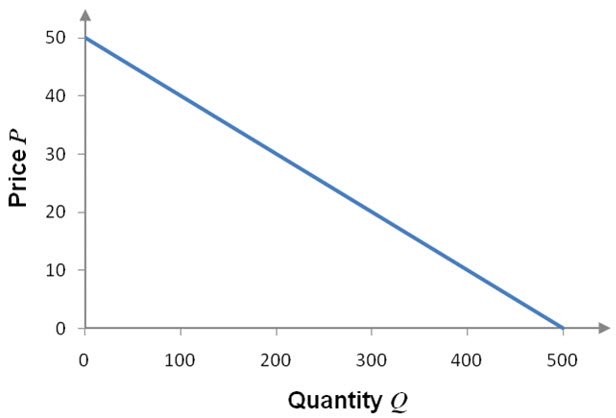
In business and finance, every equation is based on an application. The names of the variables often help you to understand what they represent. For instance, the variables P and Q usually represent the price and quantity of some good. These variables can be related to each other in one of two different ways. A demand function relates the price P of a good to the quantity Q of the good demanded by consumers. The function
is an example of a typical demand function. As Q gets larger, bigger and bigger negative numbers are added to 50 resulting in smaller and smaller values. A graph of this function reflects this characteristic. In Figure 2, the graph is a line that drops as you move from left to right. This means that as the quantity is increased (move left to right), the price drops.
Figure 2 -As the quantity Q increases from 0 to 500 horizontally, the price P drops from 50 to 0. This means that the quantity demanded by consumers increases as the price drops.
This function’s graph is a straight line. A function whose graph is a straight line is called a linear function.
Looking at the graph, it is easy to recognize a linear function. We would also like to be able to recognize a linear function from its equation.
Any equation that can be written in the form
y = mx + b
is a linear function. In this form, we say that y is a linear function of x. The letters m and b are real numbers corresponding to constants and x and y are variables.
The graph of this equation is a straight line. The slope of the line is m. The y-intercept of the line is b.
It is easy to read this definition without examining how it applies to the line . The equations y = mx + b and
may look different, but are really very similar.
The definition for a linear function contains four letters: y, m, x, and b. Some of these letters are variables and others are constants. To ensure that the user of this function knows which letters are variables and which letters are constants, we need to define the variables.
One way of doing this is to write, y is a linear function of x. By writing this phrase, we know that the variables in the equation y = mx + b are x and y. All other letters are constants representing numbers.
By modifying the phrase, we can write other linear functions with different variables. The phrase “P is a linear function of Q” corresponds to the equation
P = mQ + b
where Q is the independent variable, P is the dependent variable and m and b are constants. An example of a linear function in which P is written as a linear function of Q is
In this case, the value of m is –1/10 and b is 50.
Example 4 Does An Equation Correspond to a Linear Function?
Decide if the equation 5P + 10Q = 100 can be written so that P is a linear function of Q.
Solution To decide if the equation can be written so that P is a linear function of Q, we need to rewrite the equation in the form P = mQ + b. By stating “linear function of Q”, the example implies that the variable on the right side is Q. Solve the equation for P to put the equation in this form:
The equation can be written in the proper form with m = -2 and b = 20.
Example 5 Does An Equation Correspond to a Linear Function?
Decide if the equation 5P + 10Q = 100 can be written so that Q is a linear function of P.
Solution Compared to Example 4, this example reverses the role of the variables. “Q is a linear function of P” means that we want to rewrite the equation in the form Q = mP + b. To accomplish this task, we must solve the equation for Q:

Example 4 and Example 5 suggest that an equation must be solved for the dependent variable to determine if the equation is a linear function. The phrase
Dependent Variable is a linear function of the Independent Variable
allows you to obtain the appropriate form for the linear function. The dependent variable is always written first in this statement and the independent variable is always written after “linear function of”. Based on this phrase, we know the form will be
Dependent Variable = m·Independent Variable + b
An equation that can be written in this form, by solving for the dependent variable, is a linear function. If a function cannot be written in this form, it is not a linear function.


