
How do you evaluate a limit from a graph?
In the question before this one, we used a table to observe the output values from a function as the input values approach some value from the left of right. With a little practice, we can evaluate limits using a graph to find the values of a function. Suppose we have the graph of a function like the one below.
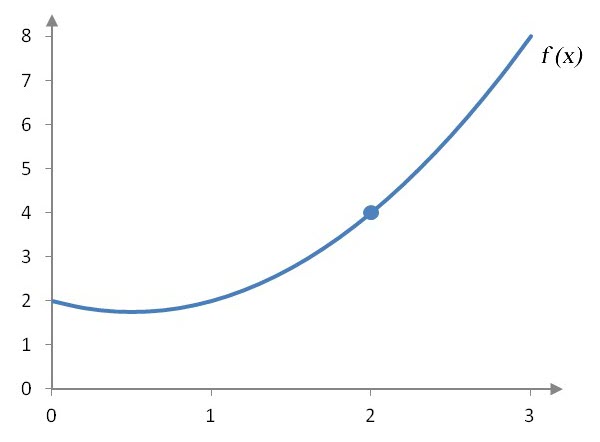
We can use this graph to evaluate the two-sided limit ![]() .
.
As with the limits we calculated from tables, we must evaluate the one-sided limits near x = 2. To calculate the limit
![]()
we must examine the graph at x values that are slightly smaller than x = 2.

Figure 1 – As the x values get closer and closer to 2 from values slightly smaller than 2, the y values approach 4.
In Figure 1, a red dashed vertical line is positioned slightly to the left of 2. The height of the line indicates the y value at that x value. A red dashed horizontal line locates the y value on the graph. As the vertical line moves closer and closer to 2, the horizontal line gets closer and closer to the y value 4. This means the limit as x approaches 2 from the left is 4 or ![]() .
.
The same strategy allows us to solve the one-sided limit
![]()
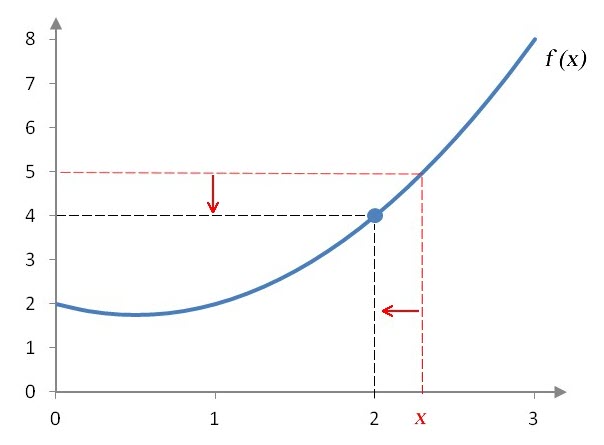
Figure 2 – As the x values get closer and closer to 2 from values slightly larger than 2, the y values approach 4.
The red dashed vertical line in Figure 2 locates an x value slightly larger than 2. The red dashed horizontal line gives the corresponding value on the y axis. As the vertical line moves closer and closer to 2, the horizontal line moves closer and closer to 4. In other words, for x values closer and closer to 2, the y values are closer and closer to 4. The limit from the right is ![]() .
.
Since the limits from the left and right are both equal to 4, the two-sided limit is also equal to 4,
Example 4 Find the Limit Graphically
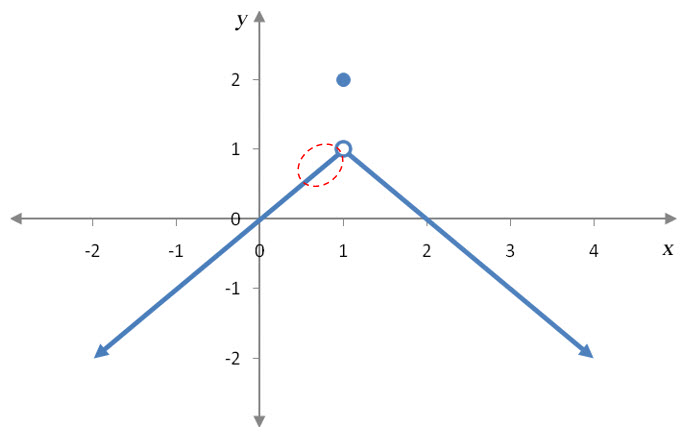
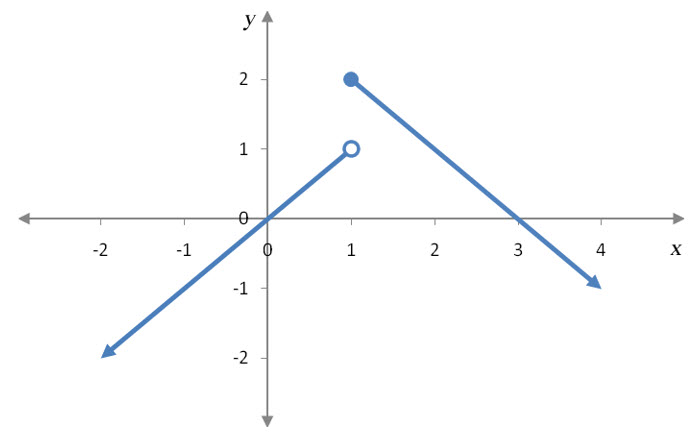
Suppose f (x) is given by the graph below.
Evaluate each of the limits below.
a. ![]()
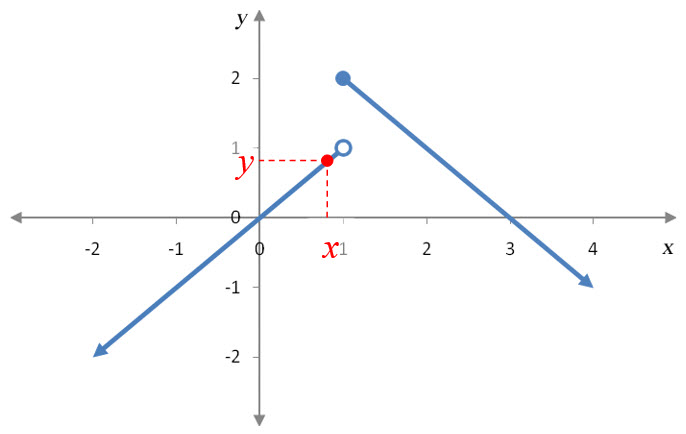
Solution To evaluate this limit, we need to examine y values on the graph as x gets closer and closer to 1 from the left side of 1. This region of the graph is shown in the graph to the below.
Let us locate an x value and its corresponding y value in this region.
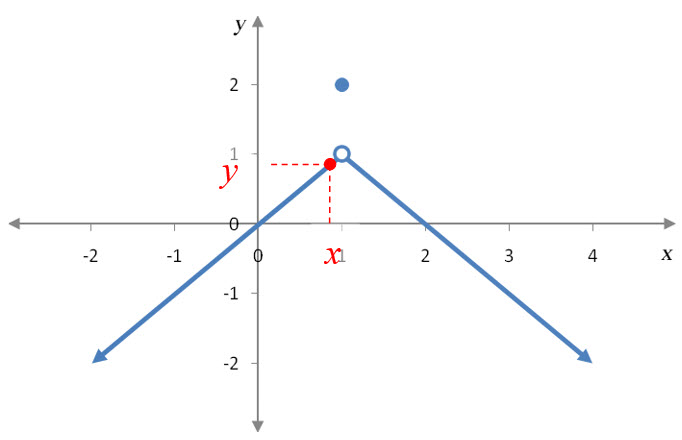
Notice that as x moves horizontally closer and closer to 1, the corresponding y value moves vertically closer and closer to 1. This tells us that ![]() . Notice that the y value at x = 1, f (1) = 2, is not the same as the limit.
. Notice that the y value at x = 1, f (1) = 2, is not the same as the limit.
b. ![]()
Solution In this one sided limit, the x values are on the right side of 1.
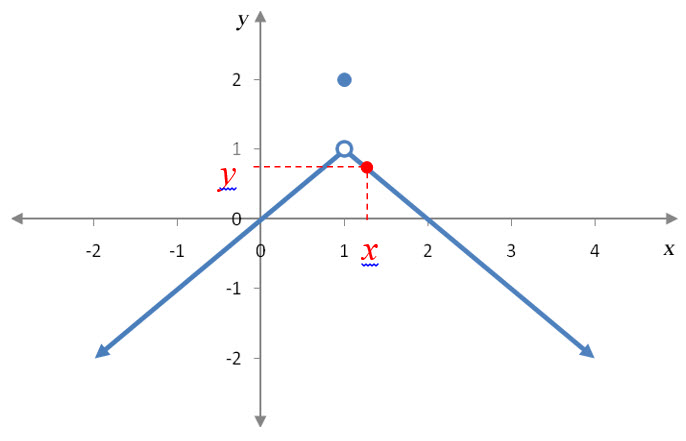
As the point moves to the left towards , the point moves up vertically towards 1. This means that the closer the point gets to x = 1, the closer the y value gets to 1 or ![]() .
.
c. ![]()
Solution For the two sided limit to exist, the one sided limits must be equal. In this case they are both equal to 1. Since they are both equal to 1, the two sided limit is also equal to 1,
Notice that none of these limits have anything to do with the fact that f (1) = 2. This is because we are using x values approaching 1, not equal to 1.
Example 5 Find the Limit Graphically
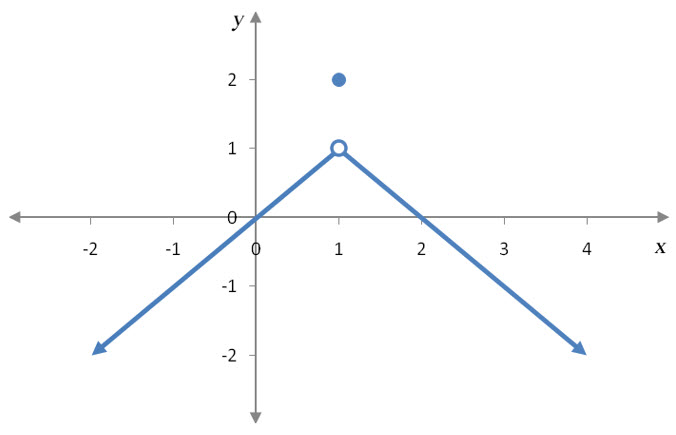
Suppose f (x) is given by the graph below.
Evaluate each of the limits below.
a. ![]()
Solution To left of x = 1, the graph looks like the graph in Example 1.
Notice that as x moves horizontally closer and closer to 1, the corresponding y value moves vertically closer and closer to 1. This tells us that ![]() .
.
b. ![]()
Solution As the point moves to the left towards x = 1, the point moves up vertically towards 2.

This means that the closer the point gets to , the closer the y value gets to 2 or ![]() .
.
c. ![]()
Solution For the two sided limit to exist, the one sided limits must be equal. In this case, they are not equal. From the left side the limit is equal to 1 and from the right side the limit is equal to 2, so
![]()
The vertical gap in the graph at is what leads to different values in the one sided limits. In Example 4, there was a horizontal gap at x = 1, but not a vertical gap since the two pieces of the graph come together at x = 1.
In each of these examples, we evaluate the one-sided limits to find the two-sided limit. If the one-sided limits are equal to some value, the two-sided limit is equal to the same value. If the one-sided limits do not match, the two-sided limit does not exist. In the next example, we examine a function for which the one-sided limit does not exist.
Example 6 Find the Limit Graphically
Suppose f (x) is given by the graph below.
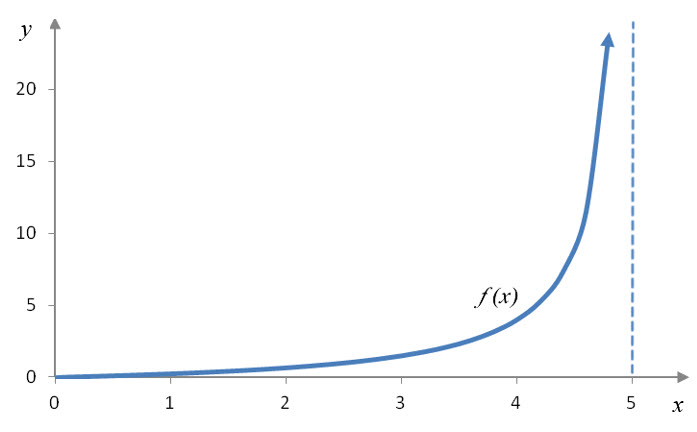
Evaluate the limit ![]() .
.
Solution This function has a vertical asymptote at x = 5. The vertical asymptote is shown on the graph as a blue dashed line.
The one-sided limit is a left hand limit. Locate points on the left side of with red dashed lines.
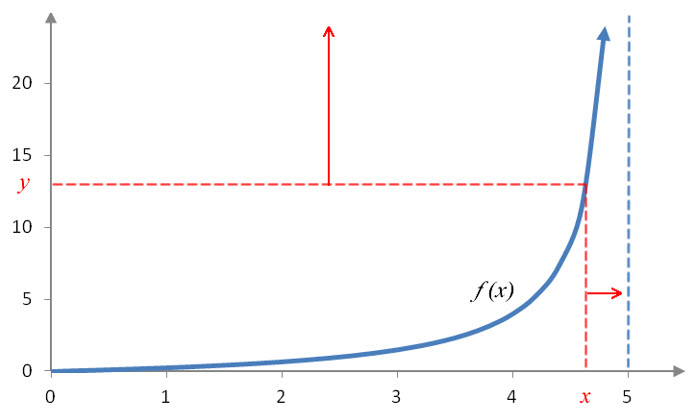
As the vertical line gets closer and closer to 5, the horizontal line gets higher and higher. This indicates that the y values do not get closer to any value as x gets closer to 5 from the left. The one-sided limit does not exist.