
What does a continuous function look like?
Let’s compare two different scenarios for the amount of tax paid for taxable incomes between 0 and 25,000 dollars.
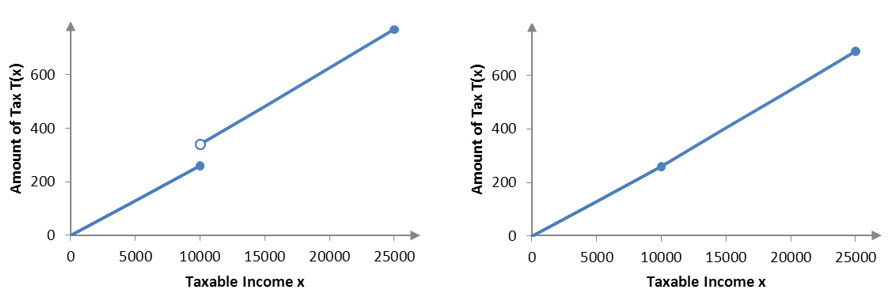
In the scenario on the left, the amount of tax increases suddenly as taxable income increases above $10,000. A jump in a function like this is called a discontinuity. It is not possible to graph a function with a discontinuity without lifting your pen off the paper. The graph on the right is a continuous function. It is possible to graph a continuous function without lifting a pen off of the graph.
If taxes in Arizona were to behave like the graph on the left, moving up to higher bracket would cause a jump in tax. However, the graph on the right displays no jump. Both graphs are slightly steeper above 10,000 because of the higher tax rate in that bracket. We’ll see in Question 2 that the amount of tax as a function of taxable income is a continuous function like in the graph on the right.
Functions can be discontinuous for several reasons. As we saw above, a graph can have a jump in it. Other graphs are not defined at some point leading to a discontinuity.
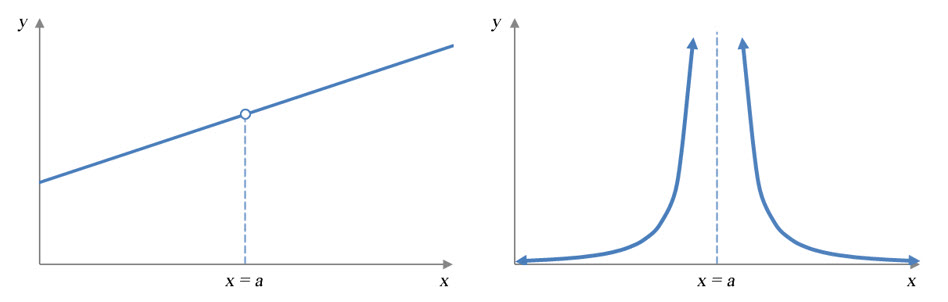
Figure 1 – Each graph is discontinuous at x = a since the functions are not defined at x = a.
In Figure 1, both functions are discontinuous at x = a since the function is not defined there. The graph on the left has a small gap in it. The graph on the right is not defined since there is a vertical asymptote in the graph.
Even if the graph is defined, it may still have a discontinuity.
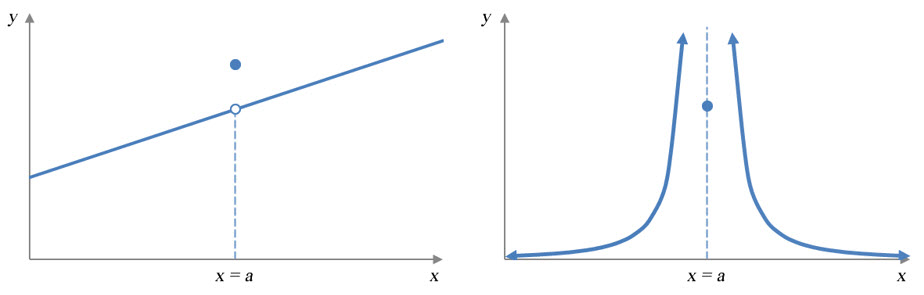
Figure 2 – Each graph is discontinuous at x = a even though the functions are defined at x = a.
If the point at x = a does not “connect” the pieces of the graph around it, it is not possible to draw the function without lifting a pen from paper. This leads to the discontinuity at x = a.
A function that can be drawn without lifting your pen from the paper is called a continuous function. Graphs of linear and quadratic functions are examples of continuous functions.
Example 1 Discontinuities
For each part, explain why the function is discontinuous at the given point.
a. f (x) at x = 1
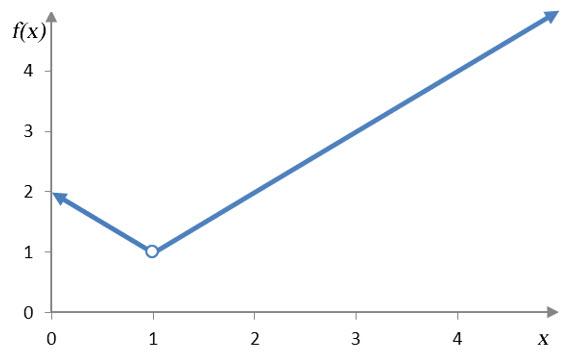
Solution Although the graph has a “kink” at x = 1, that is not the reason it is discontinuous there. The function is discontinuous since the function is not defined at x = 1.
b. g(x) at x = 3
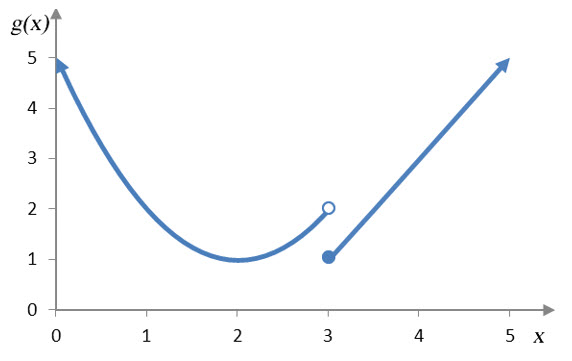
Solution This function is defined at x = 3, but the pieces of the graph do not connect leading to a vertical gap. This makes the function discontinuous.
c. h(x) at x = 2
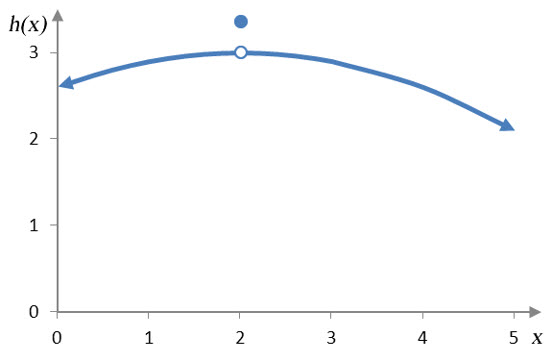
Solution The function is almost connected at x = 2, but the point where they should connect is located in the wrong place. This means we would not be able to graph the function without lifting a pen from the graph. So the function is discontinuous at x = 2.
The idea of drawing a continuous function without lifting pen from paper is not very precise. In the next question, we’ll incorporate limits into a definition of continuity.