
Instantaneous Rate of Change
The average rate of change is useful for calculating how quantities change with respect to each other. It allows us to quantify these changes and to understand whether one quantity is increasing or decreasing with respect to another quantity. Unfortunately, the average rate of change has its limitations. These limitations can be illuminated by calculating the average rate of change of the Dow Jones Industrial Average on May 6, 2010 with respect to time. The Dow Jones Industrial Average (DJIA) is an index that tracks 30 large companies on the New York Stock Exchange (NYSE). On this date, the stock market was preoccupied with news of a debt crisis in Greece. The NYSE opened at 9:30AM and the Dow Jones Industrial Average was at a level of 10862.22 points. It closed at 4:00PM at a level of 10520.32 points.
Let’s look at how the Dow Jones Industrial Average changed that day by calculating its average rate of change with respect to time. To find this rate, we must calculate the change in the index that day, ΔDJIA, and the change in time that the NYSE was open for trading, Δt.
The change in the index is calculated by subtracting the opening level of the index from the closing level of the index,
![]()
In the language of the stock exchange, the Dow Jones Industrial Average lost 341.9 points on May 6, 2010.
Since the NYSE is open from 9:30AM to 4:00PM, the change in time is 6 ½ hours or 390 minutes. We could use hours or minutes to calculate the average rate of change, but in this case we’ll use minutes and set Δt = 390.
Using these changes, we can calculate the average rate of change,
This means that, on average, the Dow Jones Industrial Index dropped slightly less than one point for each minute the NYSE is open on May 6, 2010. This may not seem like much, but in general the Dow Jones Industrial Average changes very little from day to day.
On May 6, 2010, the Dow Jones Industrial Average suffered a flash crash. A flash crash occurs when the index drops a large amount over a very short period of time. During the flash crash on May 6, 2010, the DJIA dropped over 900 points in a matter of minutes. Shortly after this drop, the index recovered these losses.
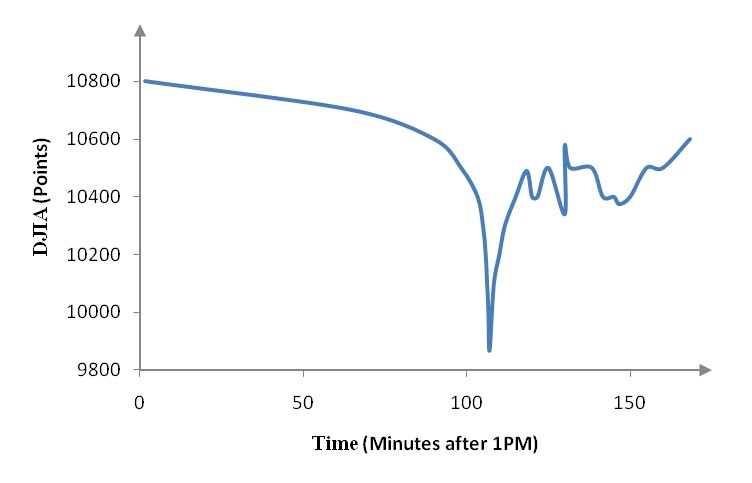
Figure 1 – This graph shows the steep drop in the DJIA before recovering on May 6, 2010.
The average rate of change we found earlier was calculated over the span of the entire trading day or 390 minutes. It takes into account the opening and closing levels of the Dow Jones Industrial Average, but nothing else over the course of the trading day. It shows what happen, on average, during the day, but not what happen in a ten minute period around 2:45PM.
To calculate how fast the DJIA was dropping during the flash crash, we need to calculate the instantaneous rate of change of the Dow Jones Industrial Average with respect to time. Like the average rate of change, the instantaneous rate of change measures fast two quantities are changing with respect to each other. As the term “instantaneous” indicates, the instantaneous rate of change measures how fast one quantity changes when another quantity changes by a very small amount.
In the case of the Dow Jones Industrial Average, we would like to calculate the instantaneous rate of change of the with respect to time at the height of the flash crash. We’ll do this by calculating how much the index changes over a very short period of time. This will tells us how fast the Dow Jones Industrial Average was dropping at the instant the flash crash occurred.
Read in Section 11.2
- How do you estimate the instantaneous rate of change?
- How do you compute the instantaneous rate of change using a limit?
Section 11.2 Workbook (PDF) – 9/4/19
Watch Video Playlist
