
How can you use a tangent line to forecast function values?
Tangent lines can be used to estimate values for functions. These estimations, called straight line or linear approximations, are often used to predict model values beyond the range of data used to create the model. For instance, the function S(t) graphed in Figure 11 models sales at Apple Inc. from 2001 through 2010. This means the data used to create the function range from t = 1 through t = 10 . This region of the graph is shaded yellow.
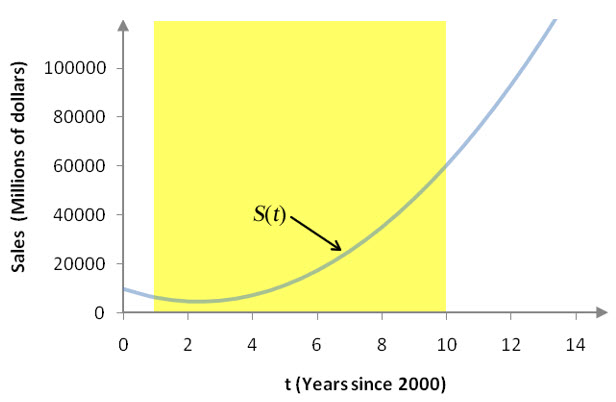
Figure 11 – A graph of the sales S(t) as a function of the number of years t based on sales data from 2001 through 2010.
If we use the model to determine the sales in the shaded region, we are interpolating the sales. Interpolation is the process of finding values for the model in the range of the data used to create the model.
We are interested in extrapolating the sales. Extrapolation is the process of finding values for the model outside the range of data values used to create the model. We want to use this model to extrapolate the sales in 2011.
We have two options for finding the sales. We could use the function to calculate the sales. Alternately, we could use the tangent line to S(t) at t = 10 to find the sales.
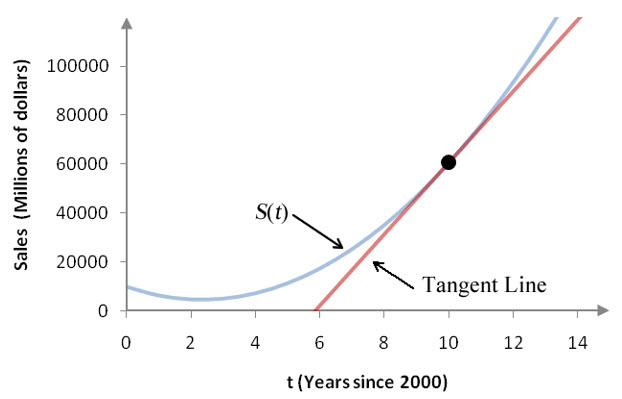
Figure 12 – The model S(t) with the tangent line to S(t) at t = 10.
In Figure 13, we see that the model S(t) and the tangent line are identical at t = 10. To the right of t = 10, the slope of the model S(t) increases so the graph curves upward. Over the same values, the tangent line increases at a constant rate equal to the derivative of S(t) at t = 10 or S′(10). Because of the differences in how the two graphs behave, the model and the tangent line slowly separate.
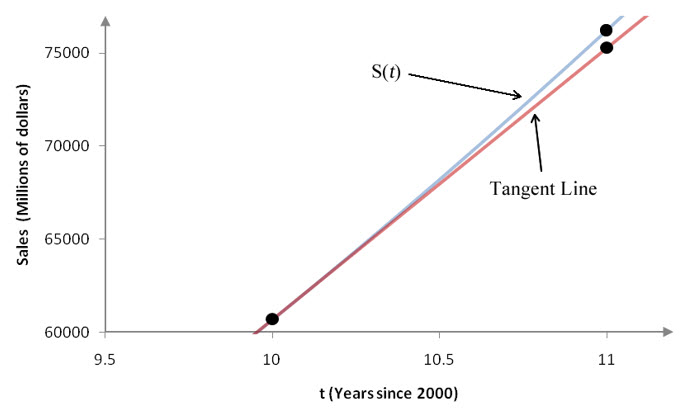
Figure 13 – S(t) and the tangent line to S(t) at t = 10 in the small interval [10, 11].
As we move even farther beyond the shaded region, the gap between the two functions becomes larger. The model S(t) increases faster and faster meaning sales must be increasing faster and faster. The tangent line increases at a constant rate of S′(t). Either graph can be used to predict the sales after t = 10, but under different assumptions.
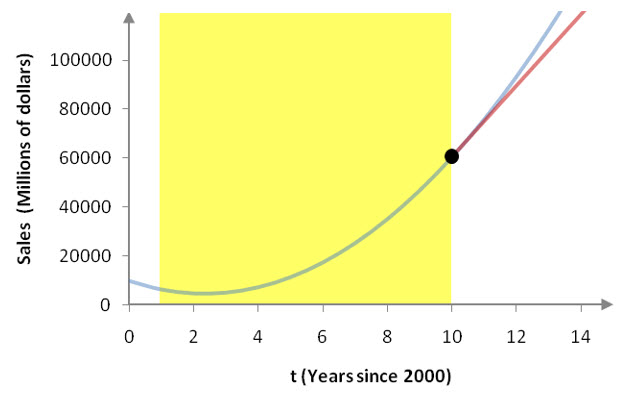
Figure 14 – A bigger picture of the model S(t), its tangent line at t = 10, and the region where the data used to find the model are located.
If we use the function S(t) to predict the sales in 2011 and find S(11), then we are assuming that rate that sales are changing will increase. Some might call this an optimistic prediction.
If we use the tangent line to predict the sales in 2011, we are assuming that sales will grow at a constant rate. This rate is the same as the rate the sales were changing in 2010. Since sales are not growing as fast in this prediction, we might think of this estimate as being more conservative. This estimate is smaller than the estimate .
Example 4 Forecast Sales Using a Tangent Line
The sales S(t) at Apple Computer from 2001 to 2010 are given by the function
![]()
where t is the number of years after 2000. Assume this model is valid for values of t in the interval [1, 10].
a. Use the tangent line at t = 10 to forecast the sales in 2011.
Solution To find the tangent line at t = 10, we must first calculate the value of S′(10). In this context, the definition of the derivative at a point is
Start by computing the function values:
 These values must be substituted into the definition for S′(10).
As with previous examples, simplifying the numerator allows the difference quotient to be simplified:
To find the value of the derivative, we must evaluate the limit,
![]()
As h approaches zero, the first term in the limit approaches zero and the second term is independent of h. This means that S′(10) = 14600.369. This value is the slope of the tangent line.
The equation of the tangent line can be written using the point-slope form of a line y – y0 = m(t – t0) where m is the slope of the tangent line. The point (t0, y0) is the point on S(t) that the tangent line passes through.
The tangent line is to pass through t = 10. To find the derivative, we calculated S(10) = 60700.1 and now we can use this value to give the equation of the tangent line,
![]()
Solve this equation for y to yield
![]()
To forecast the sales in 2011, we substitute t = 11 into the equation for the tangent line,
Following the tangent line, the sales at Apple Computer in 2011 will be 75300.469 million dollars or $75,300,469,000.
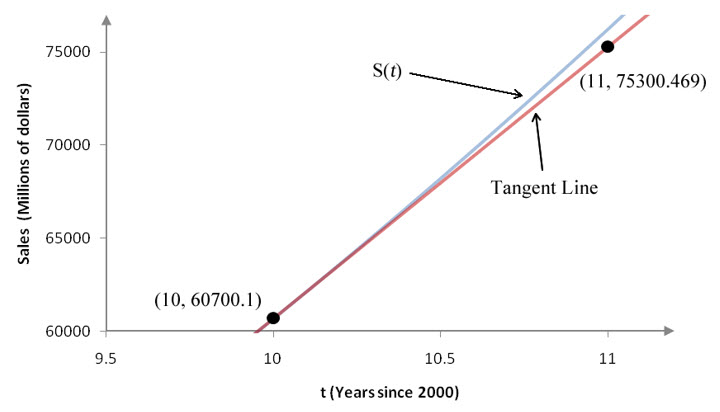
Figure 15 – The sales function S(t) is quadratic and curves upward. The tangent line uses the instantaneous rate of change at t = 10 and projects sales into the future. Since the tangent line does not curve, the projection falls farther and farther from the sales function S(t) the farther we project from t = 10.
b. How does the linear approximation in 2011 compare the model’s prediction in 2011?
Solution The model’s prediction in 2011 is
![]()
From part a, we know the linear approximation is 75,300.469 million dollars. Since the model is curving upward, its estimate is higher than the linear approximation by 76,253.435 – 75,300.469 or 952.966 million dollars. This difference may not seem like much, but is almost 1 billion dollars.
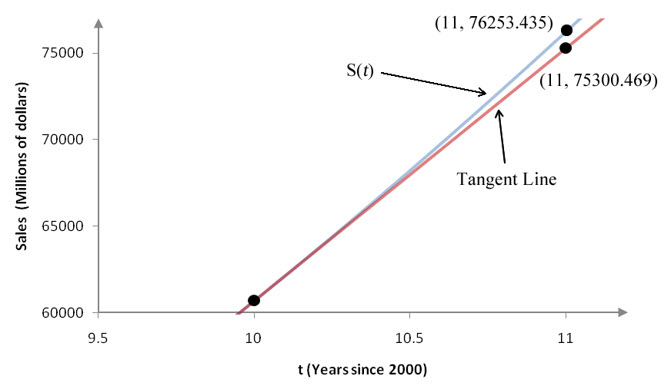
Figure 16 – The estimates of sales in 2011 based on the model S(t) and the tangent line to S(t) at t = 10.
On the tangent line in Example 4 each unit we move to the right horizontally corresponds to a vertical increase of 14600.369. Thus a simple way to view the estimate at t = 11 is to take the sales at t = 10 and add 14600.369,
60700.1 + 14600.369 = 75300.469
We can expand on this reasoning to make estimates of the sales at other points along the tangent line:
In each case, we multiply the slope by the number of units from t = 10 and add the product to or 60700.1.
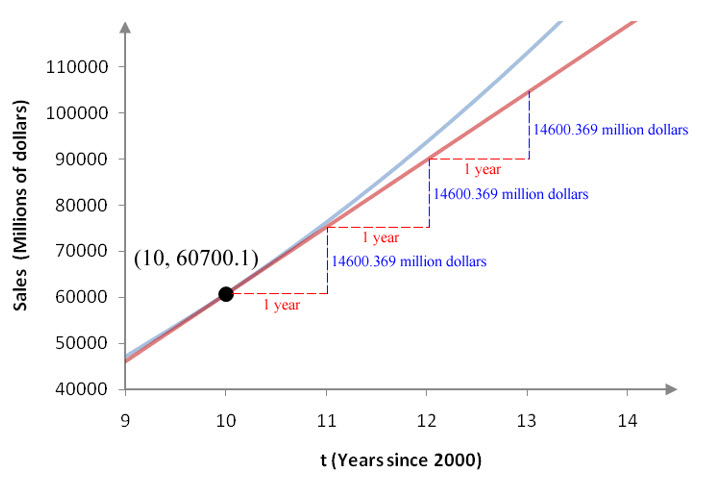
Figure 17 – The linear approximation can be visualized with the slope of the tangent line labeled carefully.
In Figure 17, we see that for each year after t = 10 the tangent line rises by 14600.369 million dollars. This is why we can approximate values along the tangent line by adding the sales at t = 10 to the product of the number of years from t = 10 times the slope of the tangent line.