
What is a critical point of a function?
The graph of a function may rise and fall resulting in relative and absolute extrema. For instance, if a continuous function falls and then rises as we move from left to right on its graph then we can deduce that the function must have a relative minimum.
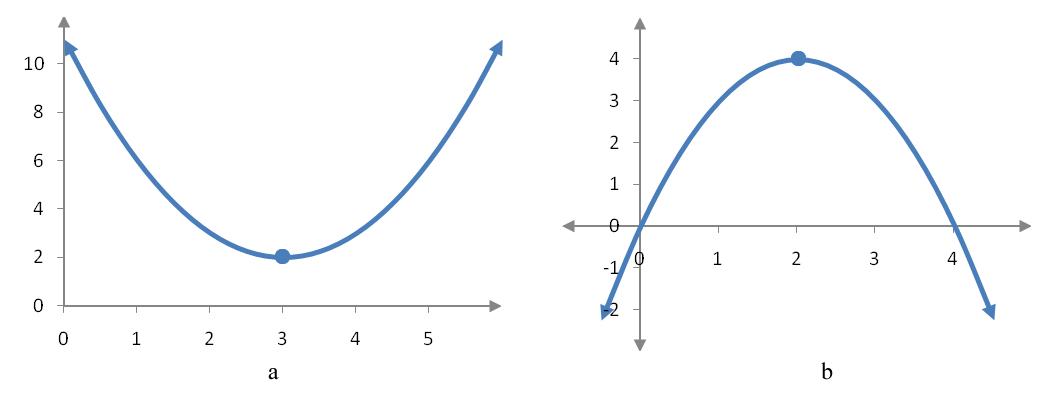
Figure 4 – When a function falls and then rises, we get a relative minimum as in (a). In (b), the function rises and then falls resulting in a relative maximum.
A continuous function that rises on the left and then drops on the right has a relative maximum. The terms increasing and decreasing are used to describe when a function is rising or falling as we move from the left to the right on the graph of a function.
Suppose x1 and x2 are two numbers in an interval over which a function f is defined.
f is increasing on the interval if f (x1) < f (x2) whenever x1 < x2.
f is decreasing on the interval if f (x1) > f (x2) whenever x1 < x2 .

Figure 5 – In (a), function values on the right are higher than function values on the left so the function is increasing. In (b), function values on the right are smaller than function values on the left so the function is decreasing.
Critical points are ordered pairs on the graph where the function can potentially change from increasing to decreasing or decreasing to increasing. This means that we will be able to use these critical numbers to find the relative extrema of a function later in this section.
Let f be a continuous function defined on an open interval containing a number c. The number c is critical value (or critical number) if f ′(c) = 0 or f ′(c) is undefined. A critical point on the graph of f has the form (c, f (c)).
When necessary, we’ll use the term stationary value to indicate critical values where the derivative is equal to zero and the term singular value to indicate critical values where the derivative is undefined.
We can test the derivative of a function at test values between the critical values to find the sign of the slope of the tangent line at the test values. This allows us to deduce whether the function is increasing or decreasing between the critical values.
Test for Determining the Intervals Where a Function is Increasing or Decreasing
Suppose a function f is defined on an open interval and that we are able to compute the derivative of the function at each point in the open interval.
If f ′(x) > 0 at every x value in the interval, then f is increasing on the interval.
If f ′(x) < 0 at every x value in the interval, then f is decreasing on the interval.
If f ′(x) = 0 at every x value in the interval, then f is constant on the interval.
Using this test, we can write down a strategy for finding all intervals where a function is increasing or decreasing.
Strategy for Tracking the Sign of the Derivative
- Take the derivative of the function and use it to find all of the critical values. Below a number line, label these values. Above the number line, write = 0 to indicate critical values where the derivative is zero or write “und” to indicate critical values where the derivative is undefined. The open intervals between these values are where we will determine the sign of the derivative.
- Pick a value in each of the open intervals between the critical values. Substitute these values in f ′(x) to determine whether the derivative is positive or negative at these values. Label the number line + or – to indicate whether the derivative is positive or negative.
- The function is increasing over the intervals where f ′(x) > 0 and decreasing over the intervals where f ′(x) < 0.
Example 5 Find Where a Function is Increasing and Decreasing
Let
![]()
Use the derivative of this function to answer the questions below.
a. Find the derivative of f (x).
Solution The derivative is found by applying several derivative rules,
So the derivative of f (x) is ![]()
b. Use the derivative to find the critical values of f (x).
Solution The critical values of f (x) are where f ′(x) is equal to zero or undefined. Since f (x) is a polynomial, it is defined everywhere. All critical values are where f ′(x). Set the derivative equal to zero and solve for x to find these points,
The critical values are x = 0, 3 and -3.
c. Find the intervals where f (x) is increasing and the intervals where f (x) is decreasing.
Solution A function is increasing when the derivative of the function is positive and decreasing when the derivative of the function is negative. Make a number line and place the critical numbers on the number line. Above each critical number place the value of the derivative, either equal to zero or undefined.
These three critical numbers divide the number line into four sections: (-∞,-3), (-3, 0), (0, 3) and (3, ∞). In each of these intervals, the graph is either increasing or decreasing. The critical numbers are where the graph could potentially change from increasing to decreasing of vice versa.
To decide where the graph is increasing or decreasing, we need to pick a test point from each interval and use it to determine the sign of the derivative at the test point. Although we can test the point in the derivative above, it is easier to use the factored form of the derivative
![]()
For instance, the test point x = -4 is in the interval (-∞,-3). If we substitute this value into the derivative we get
This tells us the function’s graph is decreasing in the interval (-∞,-3). To find where the graph is increasing, we need to test the derivative in each of the other intervals (-3, 0), (0, 3) and (3, ∞).
To simplify the testing of the derivative, we need to realize that we only need to know the sign of the derivative, not the actual value. If we substitute the value x = -4 into the derivative and note the sign of each factor, we can quickly determine the sign of the product of the factors:
A simple way to symbolize this result is to label the signs of the factors on the number line.
The product of three negative factors is negative so we know the function is decreasing in the interval (-∞,-3).
Let’s examine the test point x =-1 in the interval (-3, 0). When we examine the signs of the factors in the derivative at this value,
Label these signs above the interval on the number line:
The product of two negative numbers and a positive number is positive so the graph is increasing in the interval (-3, 0).
If we continue testing and labeling the first derivative number line, we see exactly where the first derivative is positive and negative.
Based on this number line, the derivative is positive in the intervals and . This means the graph of the function is increasing in the intervals (-3, 0) and (3, ∞).
With the number line labeled like this we can also observe that the graph is decreasing in the intervals (-∞, -3) and (0, 3).
We can check this number line by examining the graph of the function.
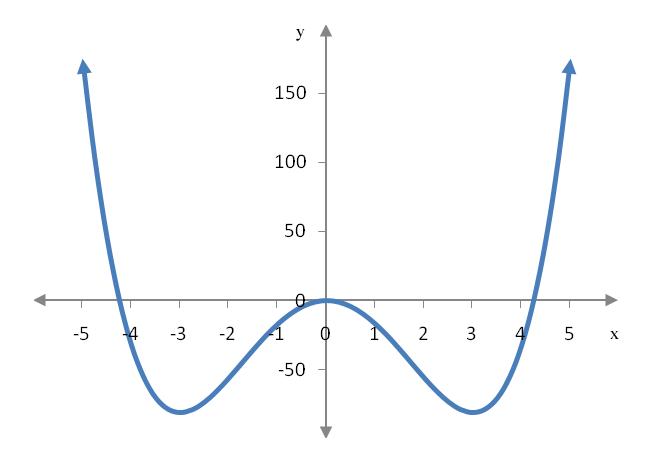
From the graph we can verify that the function increases on (-3, 0) and (3, ∞). It also decreases on (-∞, -3) and (0, 3). We should be cautious when using the graph as our only evidence of where the graph is increasing or decreasing. We can only read approximate values from the graph. The derivative allows us to find the intervals exactly.