
How do you maximize the revenue or profit for a business?
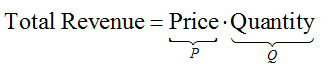
For a business to optimize its total revenue, we need to find the production level or unit price that maximizes the total revenue function. Recall that the total revenue is the product of the unit price P and the quantity Q of a product or service that is produced and sold. Using these variables, we can write
To find the total revenue function, we need to write the right hand side of this equation in terms of a single variable, either P or Q. Demand functions relate the quantity Q and the price P. If the demand function is written as a function of Q, P = D(Q), then the total revenue function is also a function of Q and
![]()
If the demand function is a function of P, Q = D(P) , then the total revenue function is a function of P and
![]()
Example 1 Maximize Revenue
Based on data from 1987 through 2009, the average price for a movie theater ticket in North America may be modeled by the demand function
![]()
where Q is the annual number of admissions in billions to North American theaters and P is the average price of a ticket in dollars.
(Source: Modeled from data provided by the National Association of Theater Owners)
a. Find the function that describes the total annual revenue from North American theaters as a function of the average price of a ticket P.
Solution The total annual revenue is found by multiplying the quantity of a product sold annually by the price at which the product is sold,
Total Revenue = Price · Quantity
For this problem, the price is represented by the variable P and the quantity is described by the demand function.
Let’s associate the appropriate symbols with this relationship,
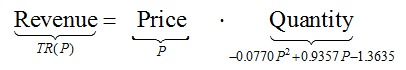
Putting in the variables and expressions, we get the revenue function
![]()
Carry out the multiplication and remove parentheses to make the derivatives easier to do,
![]()
Since the function is specified as a function of the price P, the formula is written with the variable P and not the variable Q. The units on the revenue are determined by the units on the price and quantity. The units on the average price per admission are dollars and the quantity is in billions of admissions. Thus the product has units of billions of dollars.
a. At what average ticket price will revenue be maximized?
Solution The relative maximum is found by locating all critical values and then evaluating the numbers using the first derivative test. The first derivative of ![]() is
is
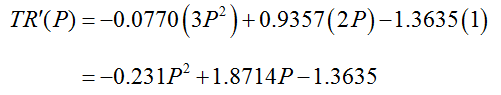
Since it is a polynomial, it is defined for all nonnegative prices. The only critical points are where the derivative is equal to zero or
![]()
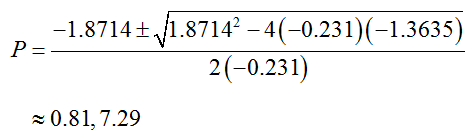
This is a quadratic equation in the variable P and is easily solved with the quadratic formula. For the quadratic equation, the constants are a = -0.231, b = 1.8714, and c = -1.3635. These constants are substituted into the quadratic formula to yield
The first derivative test allows us to track the sign of the derivative and to classify each critical value as a relative extrema or something else.
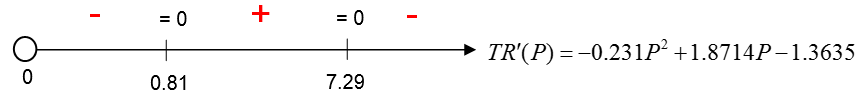
At the critical value P ≈ 0.81, the graph changes from decreasing to increasing. This critical value corresponds to a relative minimum. At the other critical value, P ≈ 7.29, the graph changes from increasing to decreasing. Consequently, this critical value is a relative maximum.
It is often easier to evaluate the second derivative to classify the relative extrema instead of the first derivative test. The second derivative is
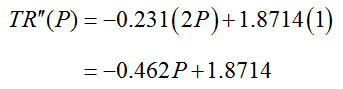
If we substitute each critical value into the second derivative, we can determine the concavity of the graph at those points. For instance,
![]()
At this critical point the graph is concave up so P ≈ 0.81 is a relative minimum. At the other critical point, the second derivative is
![]()
The graph at the critical value P ≈ 7.29 is concave down so this must be a relative maximum. This behavior is exactly the same as the behavior determined by the first derivative test.
In general, we use the first derivative test or the second derivative test to determine the relative extrema. The revenue at the relative maximum is found by substituting the critical value into the total revenue function
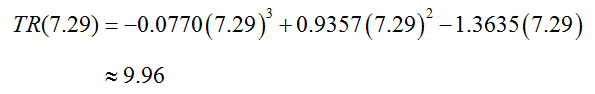
This means that an average ticket price of $7.29 maximizes revenue at 9.96 billion dollars.
Example 2 Maximize Profit
Redhook Brewery is a small regional brewery located in the Pacific Northwest. From 2000 to 2007, it operated on a small scale producing less than 300,000 barrels of beer annually. During this period, the average price per barrel of beer P (in dollars) was related to the quantity of beer sold Q (in thousands of barrels) by the demand function
![]()
The total cost of producing Q thousand barrels of beer was
![]()
Follow the parts a through c to find the quantity of beer sold that maximizes profit.
(Source: Modeled from data in Redhook Annual Reports 2000 through 2007)
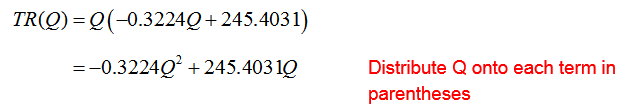
a. Find the total revenue function TR(Q).
Solution Revenue is the product of the quantity sold and the unit price of the product. For this problem, we can assign variable and expressions to give us a starting point for the revenue function,
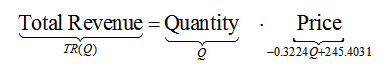
Since the independent variable is Q, we need to make sure that we include it in the function. The variable P is not used in this example and instead we use the corresponding expression for the price. If we put these variables and expressions into the relationship, we get the revenue function
b. Find the profit function Pr(Q).
Solution The relationship between profit, revenue, and cost is
Profit = Total Revenue – Total Cost
We have already defined functions for the total revenue
![]()
and the total cost
![]()
Using these functions we get
![]()
Remove the parentheses, making sure each of the cost terms is subtracted, to yield the simplified profit function
![]()
c. Find the quantity sold Q that maximizes the profit function Pr(Q).
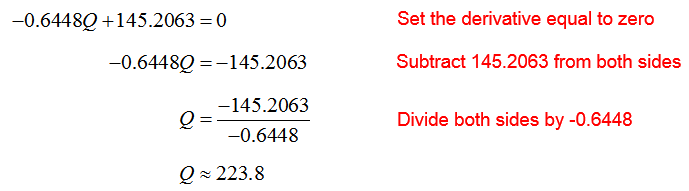
Solution To find the relative maximum on the profit function, we’ll find the critical values and utilize the first derivative test to classify them. The first derivative is
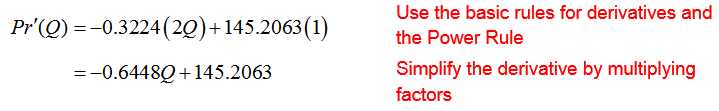
This derivative is defined for all non-negative quantities Q so the only critical values come from where the derivative is zero.
Let’s place this critical value on a first derivative number line and test the derivative.
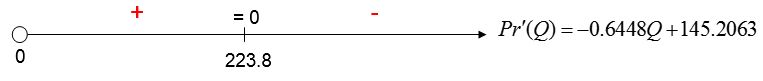
Since the derivative is positive on the left and negative on the right, we know the function increases and then decreases when we move left to right. The critical value corresponds to a relative maximum.
We could also classify the critical value by evaluating the critical value in the second derivative. The second derivative is
![]()
At the critical value, Pr″(223.8) = -0.6488 so the function is concave down. This also tells us that the critical value corresponds to a relative maximum.
The profit at this sales level is
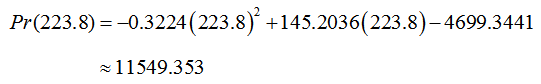
At a sales level of 223,800 barrels of beer, the maximum profit of $11,549,353 is achieved.
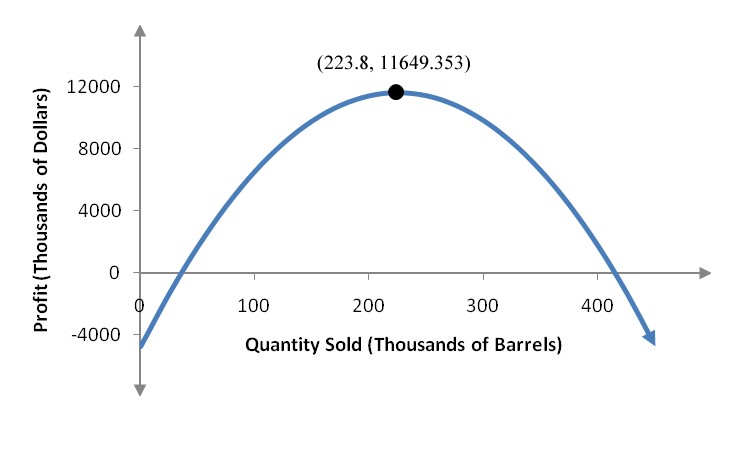
Figure 1 – The profit function for the Redhook Brewery with the relative maximum labeled.