
How do you graph a linear inequality?
To graph the solution to an inequality on a rectangular coordinate system, the inequality must contain only two variables. The craft brewery inequalities discussed above contained five variables since the brewery produced five different types of beer. Let’s simplify the inequalities to only two variables so that we can view the solutions to the inequality on a rectangular coordinate system. We’ll do this by modifying the number of beers a particular brewery produces.
Suppose a craft brewery has a monthly capacity of 50,000 barrels of beer and produces two styles of beer, a pale ale and a porter. If the brewery is not to exceed the monthly capacity, we know that
![]()
where x1 is the number of barrels of pale ale produced each month, and x2 is the number of barrels of porter produced each month.
Using and may seem confusing, but we could have easily written this same inequality as
![]()
where x is the number of barrels of pale ale produced each month, and y is the number of barrels of porter produced each month. The names of the variables are irrelevant. However, since we want to be able to generalize two variable problems to problems with more than two variables, we’ll stick with subscripts for this example.
When an inequality in two variables is graphed, we start by changing the inequality to an equation. The equation for this craft brewery is
![]()
We’ll graph this equation with x1 on the horizontal axis (the independent variable) and x2 on the vertical axis (the dependent variable). It is perfectly acceptable to switch the variables on the axes. The key is to pick an axis for each variable and to stick with it throughout the entire problem.
The easiest way to graph this equation is by using the intercepts. By setting each variable equal to 0, we can find the corresponding value for the other variable:
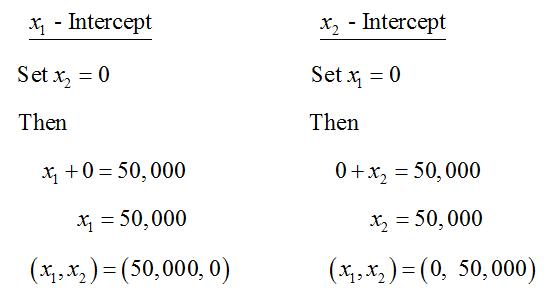
Drawing a line through these two points gives us the following graph:

Figure 3 – The line x1 + x2 = 50,000 passes through the intercepts at (0, 50,000) and (50,000, 0).
For every point on this line, the sum of x1 and x2 is 50,000. For instance, the point (25000, 25000) is on this line since . Points that are not on the line have a sum that is either greater than or less than 50,000. The line in the graph forms the border between points where the sum is greater than 50,000 and points where the sum is less than 50,000.
To determine which side is which, pick a convenient point on the graph that is not on the line. Test this point in the original inequality. If the inequality is true, then every point on the side of the line the test point comes from is in solution to the inequality. If the inequality is false when the test point is substituted, all points on the opposite side of the line from the test point are in the solution for the inequality. By shading the half plane where the test point is true, we can indicate all of the ordered pairs in the solution set of the inequality.
When the inequality includes an equal sign (like < or >) we draw the line separating the two half planes with a solid line. This tells us that the line corresponding to the border, x1 + x2 = 50,000, is included in the solution set of the inequality.
For the inequality , a convenient test point is (0, 0). Set x1 = 0 and x2 = 0 to yield 0 + 0 < 50,000. Since this is a true statement, all of the points on this side of the line satisfy the inequality. To show this graphically, we shade all of the points on that side in the graph and graph the border as a solid line.
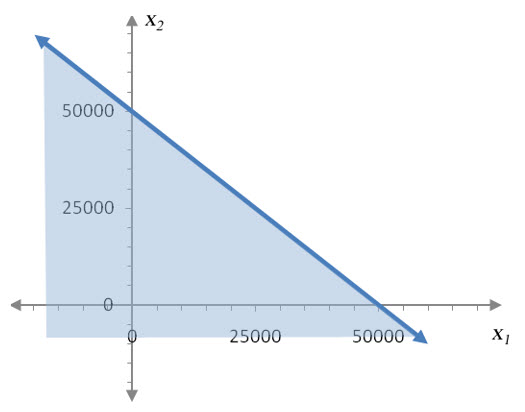
Figure 4 – The solution set to x1 + x2 < 50,000 extends infinitely far below and to the left of the line and includes the line x1 + x2 = 50,000.
If the inequality is a strict inequality (with no equal sign), the line separating the two half planes is drawn with a dashed line. This tells you that the border is not included in the solution set. For instance, the solution set to the inequality x1 + x2 < 50,000 is shown in Figure 5.

Figure 5 – The solution set to x1 + x2 < 50,000 extends infinitely far below and to the left of the line and does not includes the line x1 + x2 = 50,000.
Graphing a Linear Inequality in Two Variables
- Identify the independent and dependent variables. Begin the graph of the solution set by labeling the independent variable on the horizontal axis and the dependent variable on the vertical axis.
- Change the inequality to an equation by replacing the inequality with an equal sign.
- Graph the equation using the intercepts or another convenient method. If the inequality is a strict inequality, like < or >, graph the line with a dashed line. If the inequality includes an equal sign, like < or >, graph the line as a solid line.
- Pick a test point to substitute into the inequality. Test points that include zeros are easiest to work with. This test point must not be a point on the line.
- If substituting the test point into the inequality makes it true, shade the side of the line containing the test point. If substituting the test point into the inequality makes it false, shade the side of the line that does not contain the test point.
Example 1 Graph the Linear Inequality
Graph 15x + 20y < 300.
Solution This linear inequality uses two variables, x and y. We’ll choose x as the independent variable and y as the dependent variable. This means that the horizontal axis will be labeled with x, and the vertical axis labeled with y.
To graph the border between the two half planes, we need to graph 15x + 20y = 300. This is done by solving for y:
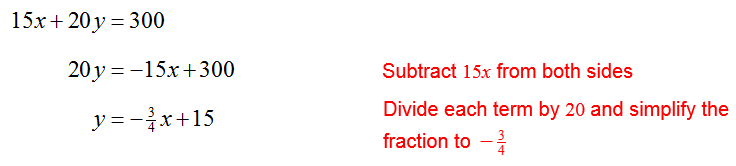
In slope-intercept form we recognize the slope, –3/4, and vertical intercept, 15, and use them to graph the line. Since the inequality is a strict inequality, the line must be graphed as a dashed line.
For some equations it may be easier to find the intercepts of the equation:
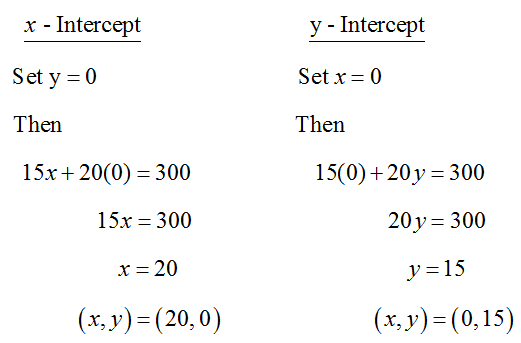
Using the slope-intercept method or the intercept method, the graph of 15x + 20y = 300 looks the same.
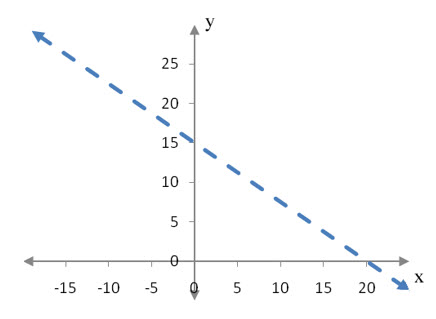
Figure 6 – The line 15x + 20y = 300 is the border between half planes. Note the slope of the line and the intercepts. Either method gives the same line. Since the inequality is a strict inequality, the line will be drawn as a dashed line.
Any point that is not on the line can be the test point. We’ll test the point (5,5). Putting this ordered pair into the inequality yields
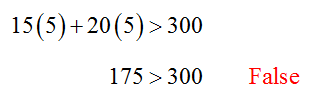
Since this ordered pair does not satisfy the inequality, shade the portion of the plane on the other side of the line from the test point.
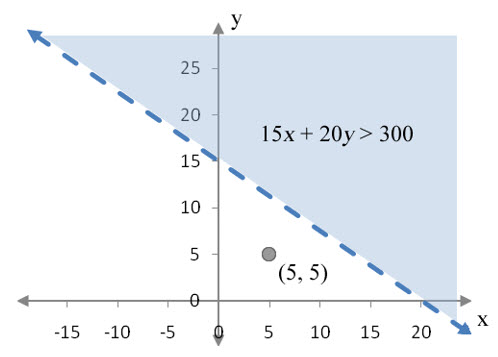
Figure 7 – The solution set to 15x + 20y > 300 extends infinitely far above and to the right of the dashed line.
Example 2 Find and Graph the Linear Inequality
At a craft brewery, four different ingredients are combined to create beer. Yeast, malted grain, hops and water are mixed, cooked, and fermented in large kettles. The production of beer is limited by several factors. First, the size of the equipment limits the number of barrels that can be produced to 50,000 barrels per month. If x1 barrels of pale ale are produced and x2 barrels of porter are produced, we know that
![]()
Production is also limited by the availability of grain, the capacity to ship grain to the brewery, and the storage capacity at the brewery. The brewery can process and store 4,000,000 pounds of malted grain per month. For each barrel of pale ale, the brewery uses 69.75 pounds of malted grain. For each barrel of porter, the brewery uses 85.25 pounds of malted grain.
Using this information, write and graph a linear inequality describing the total amount of malted grain used each month at the brewery.
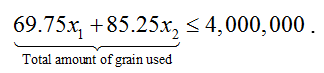
Solution To write an inequality for the total amount of grain, we need to recognize that this brewery can use no more than 4,000,000 pounds of malted grain each month,
![]()
Malted grain is used in each of the two beers produced. The amount of grain used in the pale ale is found by multiplying the amount of grain used per barrel times the number of barrels of pale ale produced,
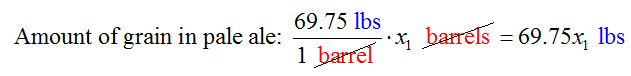
The units in these two factors reduce to yield overall units of pounds.
We can also determine the amount of grain in the porter by writing
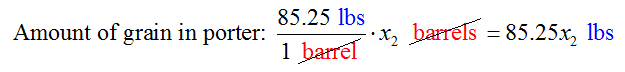
Combining the amount of grain in the pale ale, 69.75x1, and the amount of grain in the porter, 85.25x2, yields the inequality for the grain usage,
To graph this inequality, change the inequality to an equal sign,
![]()
and find the intercepts:
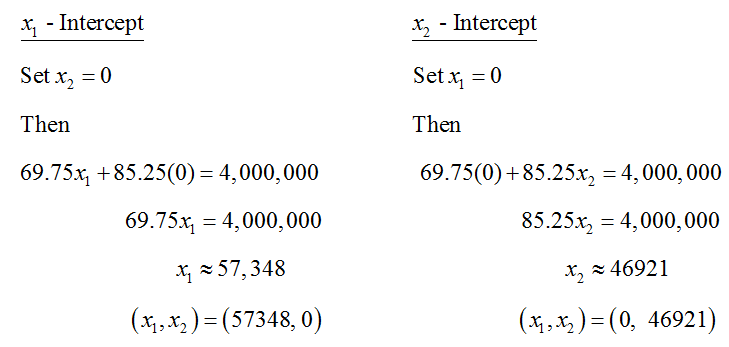
As before, we’ll graph this line with as the independent variable. We also use a solid line since the inequality includes an equal sign.
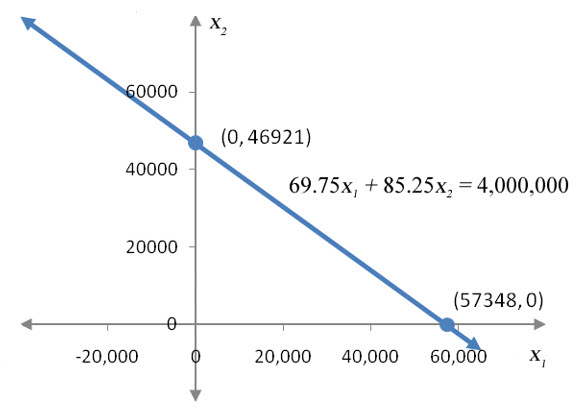
Figure 8 – The border for the inequality. The border is drawn with a solid line since the line is included in the solution set.
Pick a convenient test point like (0, 0) to see which side of the line is in the solution set.
If we set x1 =0 and x2 =0 in the inequality, we get
Since the test point at the origin makes the inequality true, shade the side of the line that includes the origin.
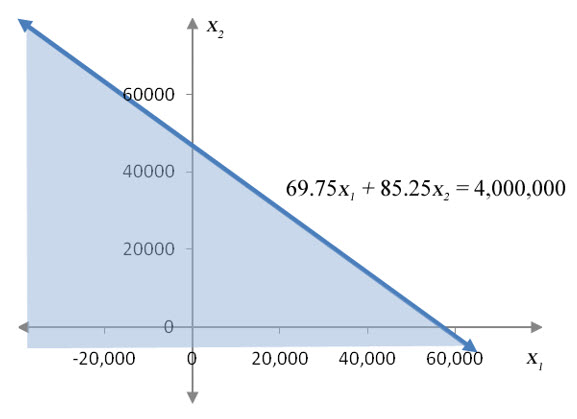
Figure 9 – The solution set for 69.75x1 + 85.25x2 < 4,000,000 extends infinitely far to the left and below the line.
Example 3 Find and Graph the Linear Inequality
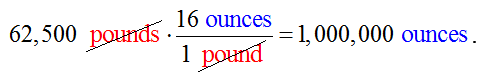
Hops are also used to make the pale ale and porter styles of beer. Each barrel of pale ale requires 23.8 ounces of hops. Each barrel of porter requires 10.85 ounces of hops. The brewery is able to acquire 62,500 pounds of hops each month. If barrels of pale ale are produced, and barrels of porter are produced, find and graph the inequality describing the total amount of hops used each month.
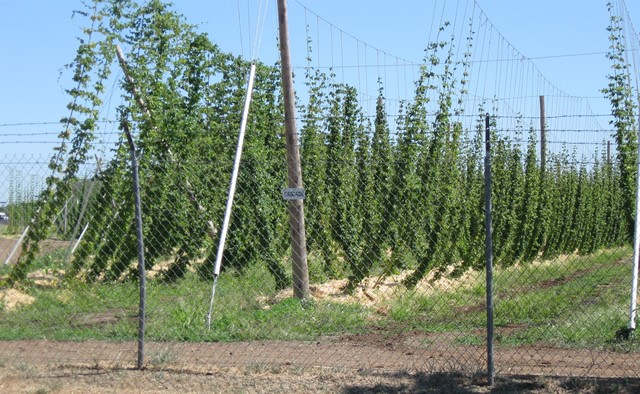
Figure 10 – Cascade hops growing in Chico, California.
Solution This example is very similar to Example 2. The main difference is the different units in the problem. In this example we’ll derive the inequalities in terms of ounces.
To convert the total amount of hops to ounces, we would calculate
Now the total amount of hops used must satisfy
![]()
The total amount of hops is the sum of the amount of hops in each beer. The amount of hops in x1 barrels of pale is
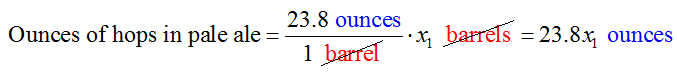
The amount of hops in x2 barrels of porter is
![]()
In each of these expressions, the units reduce to give overall units of ounces. The sum of the amount of hops in each beer must be less than or equal to 1,000,000 ounces or
![]()
To graph the inequality, we graph the border of the solution set defined by the equation 23.8x1 + 10.85x2 = 1,000,000. The easiest way to graph this equation is to find the intercepts of the graph.
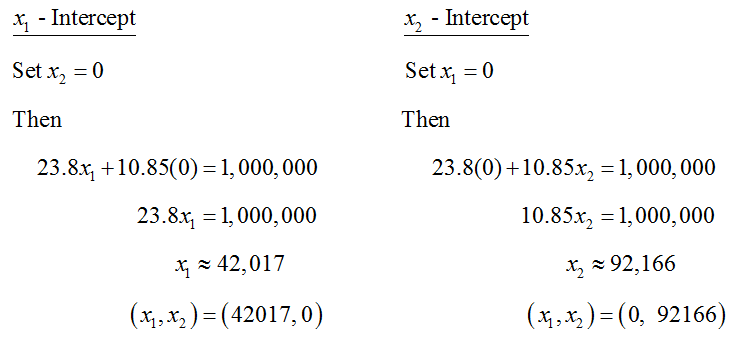
The intercepts of the corresponding equations are at approximately (0, 92166) and (42017, 0).
By testing the inequality 23.8x1 + 10.85x2 < 1,000,000 at the origin,
![]()
we see that the side of the line including (0, 0) must be shaded. This gives the solution set shown below.
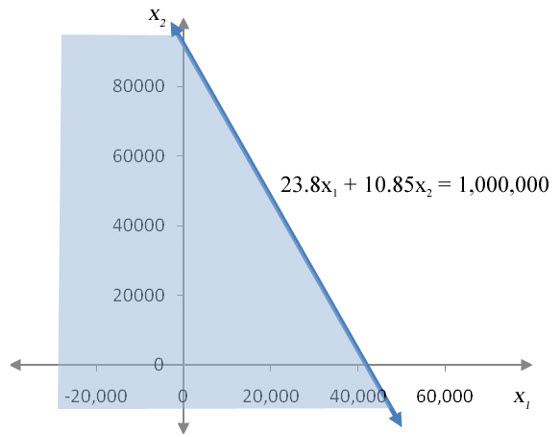
Figure 11 – The solution set for the hops inequality lies to the left of 23.8x1 + 10.85x2 = 1,000,000.