
How do you make a histogram?
A frequency histogram is a visual representation of the information in a relative frequency table. The classes for the data are shown on the horizontal axis. The frequencies are represented on the vertical axis using rectangular bars.
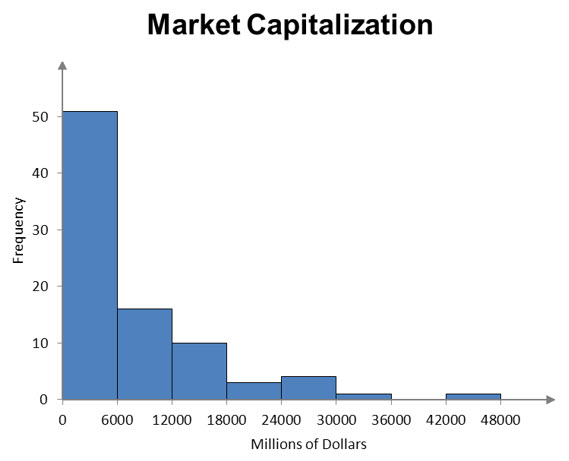
Figure 1 – A frequency histogram for the market capitalization of selected companies in the energy sector.
Each rectangular bar on the graph spans the class horizontally. The width of the bar is the width of the class. If the classes have equal widths, then each bar has the same width.
The height of the bar is the frequency from the frequency table.
Example 5 Make a Histogram
In Example 4, we made a frequency table for wait times at a bank.
Use this table to make a frequency histogram.
Solution The horizontal axis is labeled with the classes. Above each class is a rectangle whose height corresponds to the frequency for that class.

A relative frequency histogram differs slightly from a frequency histogram. In a relative frequency histogram, the relative frequencies are graphed vertically. For Example 5, the relative frequency histogram looks almost identical to the frequency histogram.
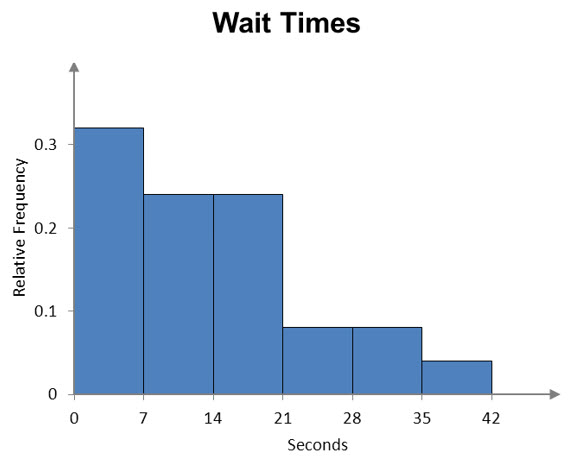
Figure 2 – A relative frequency histogram of the wait times at the bank. Note the different vertical scale for relative frequency.