What is the mean of a dataset?
The mean or average of a set of data may be calculated for a sample or a population. For a population, the mean is named using the Greek letter μ (mu).
Population Mean
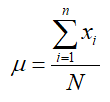
Let denote the ith observation of a variable x from a population with N total observations. The population mean is
You are probably already familiar with the computation. In simple terms, add up the data values and divide by the total number of data values.
The numerator of the mean is often written in sigma notation as Sigma notation indicates a sum where each term has the form xi. In each term, a different value if i is substitute from i = 1 to N. If we use sigma notation, the definition for population mean becomes
This definition may also be abbreviated by dropping the subscript i. In this case, we get
In each case, the mean is found by summing the data and dividing by the total number of data.
Example 1 Find the Population Mean
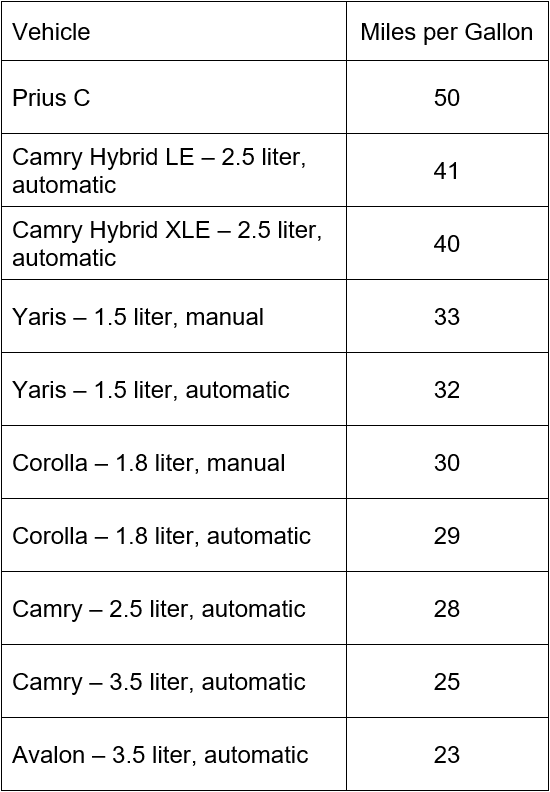
In 2012, Toyota claimed to have the most fuel efficient passenger car fleet. Based on mileage estimates from Edmunds.com, the table below shows the mileage of passenger vehicles manufactured by Toyota.
Use this table to find the mean miles per gallon for Toyota passenger vehicles in 2012.
Solution Since the data in the table include the miles per gallon for all Toyota passenger vehicles, this data constitutes a population. If we were using this group of vehicles to find the mileage of all Toyota vehicles, then it would have been a sample from the larger population of Toyota vehicles.
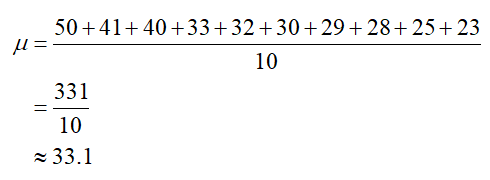
To find the mean, add the mileage values and divide by the total number of passenger vehicles in the Toyota fleet,
According to the mean, the center of the data values is approximately 33.1 miles per gallon.
When the mean is calculated from a sample of data drawn from a larger population, the mean is symbolized using.
Sample Mean
Let denote the ith observation of a variable x from a sample with n total observations. The sample mean is
The sample mean is calculated exactly the same way as the population mean. The main difference is how we think about the data. If the data values constitute a population, the mean is denoted μ. If the data values are a sample from a larger population, then the sample is denoted In either case, we add up to data values and divide by the total number of values to find the mean.
Example 2 Find the Sample Mean
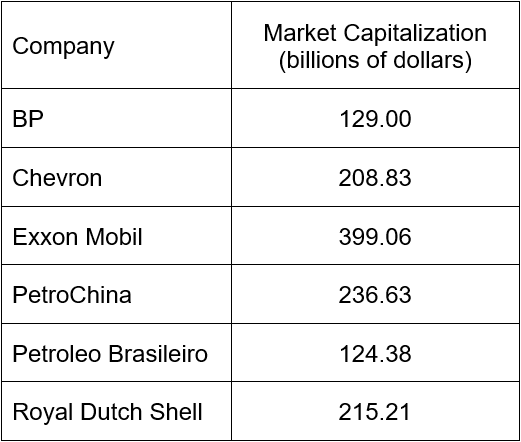
A sample of six companies are selected from companies in the energy sector on the New York Stock Exchange. The market capitalization (as of July 6, 2012) of each company is recorded in the table below.
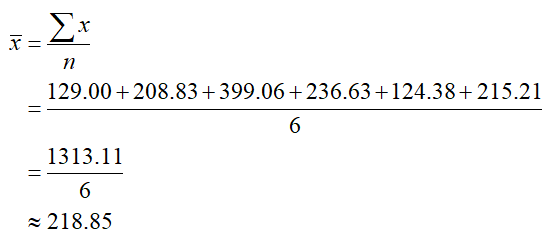
a. Find the mean market capitalization of these companies.
Solution The variable x represents the market capitalization. The sample mean is
b. These six companies are the largest companies in the energy sector. Do you think the mean is reflective of the market capitalizations of the entire population of the energy sector?
Solution This sample contains six companies with the highest market capitalizations in the energy sector. The population of companies would contain many other companies with much smaller market capitalizations. Because of this, the population mean would be much smaller. The sample mean is not representative of the market capitalizations for the entire energy sector.
The mean may also be calculated if the data is given in a frequency table. Instead summing all of the individual data, we multiply each data value by its frequency and add the products. Then we divide this sum by the total number of data.
Example 3 Mean of Data in a Frequency Table
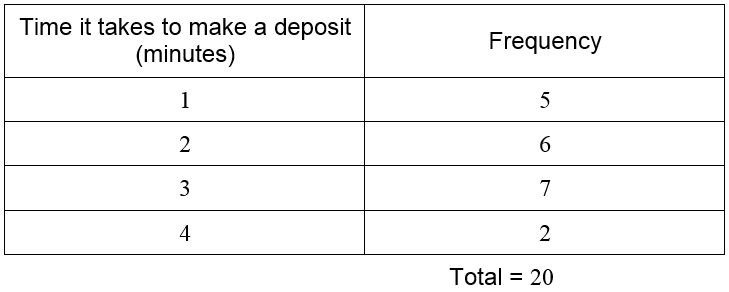
In section 6.1, we constructed a frequency table for the time it takes a customer to make a deposit at a bank. The original data was shown in a table,
and used to create a frequency table.
a. Use the frequency table to compute the sample mean for the twenty customers.
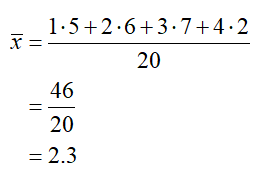
Solution This data was originally given as twenty separate values. Although we could simply list those values and add them to find the mean, it is easier to find the product of the times and their corresponding frequencies. When we do this, we get
The mean time it took customers to make a deposit in this sample is 2.3 minutes.
b. Use the original data to find the sample mean for the twenty customers.
Solution Add the data and divide by the total number of data,
The sum in the numerator is the same if a frequency table or the original data is used. If the frequencies are available, it is easier to multiply them times the data value than adding all of the individual values.


