“Mid-West 070” by The History Faculty is licensed under CC BY-ND 2.0
Prior to the presidential election in 1948, numerous polls and analysts predicted that incumbent president Harry S. Truman would lose the election to Governor Thomas Dewey of New York. At the time, newspapers needed to go to press before the election was called. The Chicago Daily Tribune relied on the advice of their correspondent Arthur Sears Henning who had predicted the winners in the previous four presidential elections. Despite all of the polling indicating a Dewey presidency, Truman won the election by a narrow margin.
Statistical studies like polls rely upon smaller sets of data from samples in the hope that they reflect the statistics of a larger population. In the case of presidential polling, we hope that the preferences of Americans polled reflect the preferences of Americans who vote in the election.
In this section we will examine how a population is sampled to make sure the sample is not biased. In other words, we want this statistics of the sample to reflect the statistics of the corresponding population. You will learn to
- identify the type of sampling used in a statistical study,
- identify potential sources of bias in a statistical study
Use the workbook and videos below to learn about sampling and bias. Make sure you work through the guided examples and the corresponding practice problems.
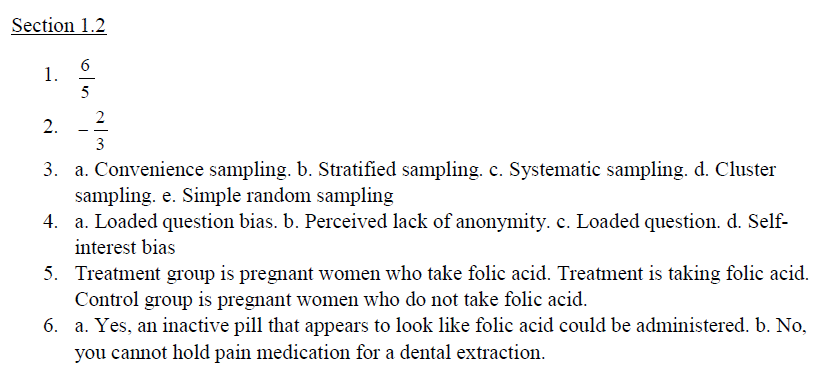
Section 1.2 Practice Solutions
Chapter 1 Practice Solutions (PDF)(7-28-19)
Videos by Mathispower4u by James Sousa is licensed under a Creative Commons Attribution-ShareAlike 3.0 Unported License.


