“average” by CreditDebitPro is licensed under CC BY 2.0
When we are given a large set of data, it is difficult to look at it and get a meaning from it. In the graphic above, each state is color coded by its mean elevation. To calculate this information, thousands of pieces of data needed to be analyzed to determine what the central tendency for elevation was in each state. Examining the graphic, we se that the elevations in the western US are higher than in the eastern US. This trend would probably not have been obvious from the raw data.
In this section, we’ll begin to examine descriptive statistics. Descriptive statistics are numbers that are used to summarize the data. For this section, we’ll look at numbers which help us to determine the central tendency of a set of data. Our objectives for this section are to
- Compute the mean, median and mode of data.
These measures will allow us to compare the central tendency in two different sets of data.
Use the workbook and videos below to learn how to compute these measures of central tendency. Make sure you work through the practice problems for computing these measures from raw data as well as frequency tables.
Section 1.4 Workbook on Measures of Central Tendency (PDF) (7-31-19)
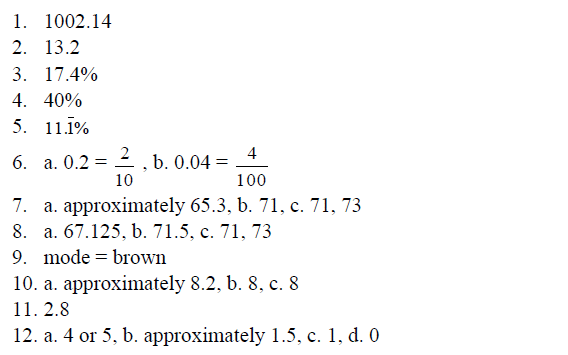
Section 1.4 Practice Solutions

Chapter 1 Practice Solutions (PDF)(7-28-19)
Videos by Mathispower4u by James Sousa is licensed under a Creative Commons Attribution-ShareAlike 3.0 Unported License.

