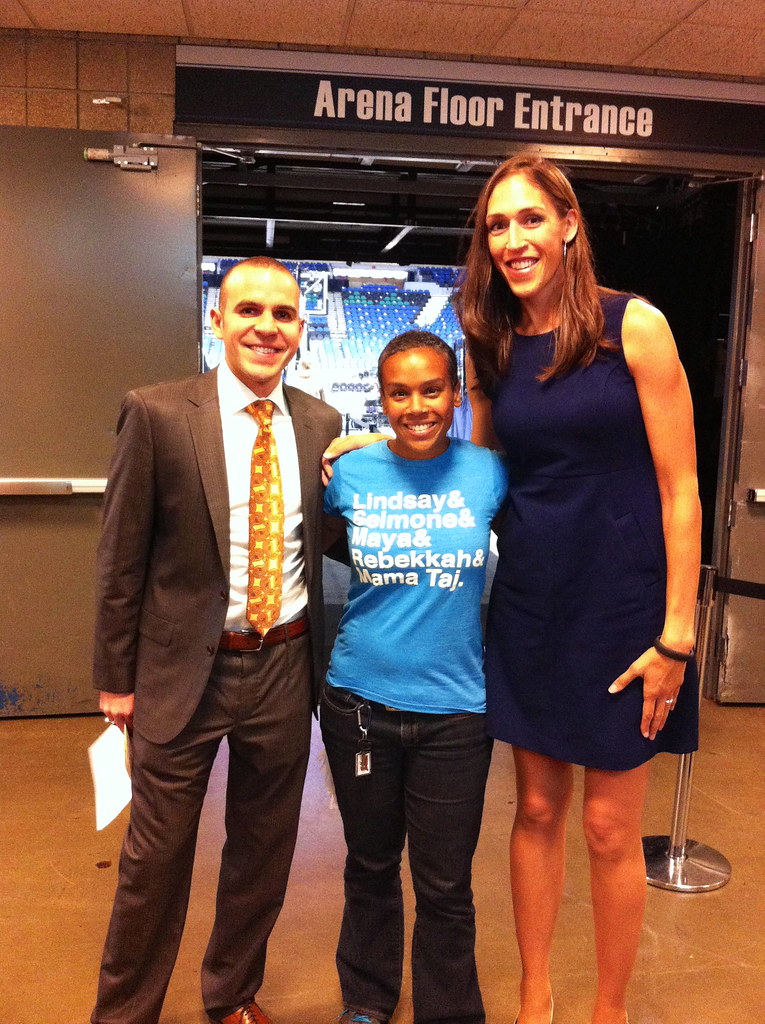
“Ryan Ruocco, me, Rebecca Lobo” by swirlspice is licensed under CC BY-NC-SA 2.0
Players in the National Basketball League (NBA) range from 5’9″ (Kay Felder) to 7’3″ (Boban Marjanović) with a mean of about 6’7″. If we compare this to players is the Women’s National Basketball League (WNBA), we see that heights range from 5’5″ (Leilani Mitchell) to 6’9″ (Brittney Griner). The mean in the WNBA is about 6′.
It is not surprising to see that the NBA has a greater mean since men are taller than women in general. However, is there more variation in height in the NBA or in the WNBA? TO answer this question, we need to calculate whether the men are farther from the mean and compare it to the same measure for women. This is precisely what the standard deviation measures…deviations from the mean.
In this section, you will learn how to
- compute the range of a data set,
- compute and interpret the standard deviation of a set of data.
- compute and interpret the coefficient of variation for a set of data,
- compute a five number summary of a set of data
- interpret quartiles and percentiles,
- construct a stem and leaf plot.
These measures will allow you to determine how spread out a set of data are.
Use the workbook and videos below to learn how to compute these measures of variation. Remember to complete the practice problems so that you can do these computations yourself.
Section 1.5 Measures of Variation (PDF) (7-31-19)
Section 1.5 Practice Solutions


Chapter 1 Practice Solutions (PDF)(7-28-19)
Videos by Mathispower4u by James Sousa is licensed under a Creative Commons Attribution-ShareAlike 3.0 Unported License.

