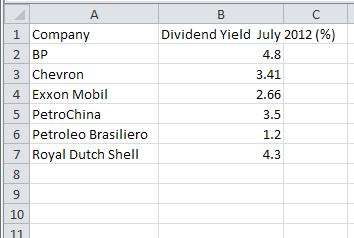
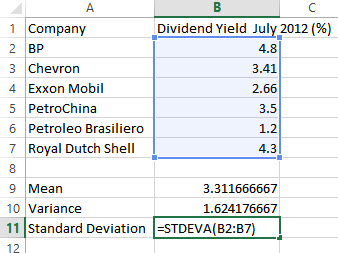
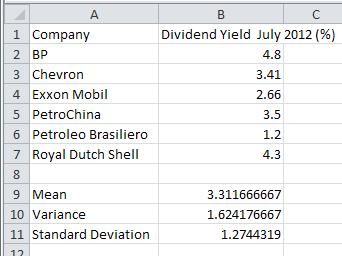
The table below shows the dividend yields of six companies in the New York Stock Exchange energy sector.
| Company | Dividend Yield July 2012 (%) |
| BP | 4.80 |
| Chevron | 3.41 |
| Exxon Mobil | 2.66 |
| PetroChina | 3.50 |
| Petroleo Brasiliero | 1.20 |
| Royal Dutch Shell | 4.30 |
a. Find the sample mean.
Solution Use the AVERAGE command in a spreadsheet to compute the mean.
1. Enter the data from the table into the different cells in the spreadsheet.
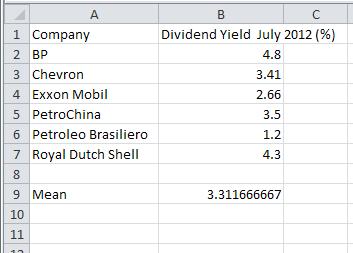
2. In cell A9, type Mean to indicate that the number in B9 will be the mean.
3. Click on cell B9. This is where we will place the mean of the data. Type =AVERAGE( as shown to the right. To indicate the location of the data, type B2:B7. You can also click in cell B2, hold the left mouse button down and drag the cursor to cell B7. Type ) to complete the command.
4. Press Enter to compute the mean.
b. Find the sample variance.
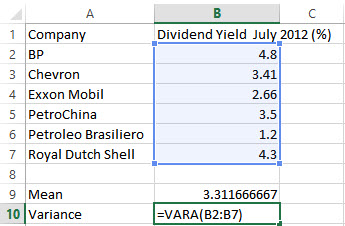
Solution Use the VARA (VARPA for population variance) command to compute the sample variance of the data.
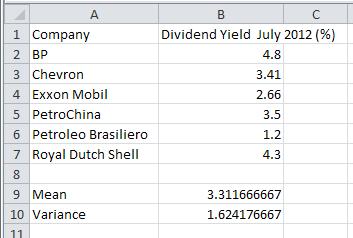
1. Type Variance in cell A10. Since we need the sample variance, type =VARA( in cell B10. Type B2:B7 or drag select these cells to identify the location of the data.
2. Press Enter to compute the sample variance.
c. Find the sample standard deviation.
Solution Use the STDEVA command to find the sample standard deviation of the data.
1. In cell A11, type Standard Deviation. In cell B11, type STDEVA( . Type B2:B7 or drag select these cells to identify the location of the data. To compute the population standard deviation, you would use the command STDEVPA. Type ) to complete the command.
2. Press Enter to compute the sample standard deviation.

