
 The most challenging part of these systems of inequalities is writing them out. The key is to write out the variables explicitly. This forces you to read the problem carefully as well as look for relationships between the different quantities in the problem.
Let’s look at another example where we wish to write and graph a system of inequalities corresponding to an application.
Problem A retiree wishes to invest in bonds and stocks. He has a total of 1.2 million dollars to invest. Bonds earn an average of 3% per year and stocks return an average of 8% per year. The retiree needs at least 60,000 dollars in returns each year to live on. Graph a system of inequalities that indicates all possible amounts that may invested in bonds and stocks. Label the corner points on the solution.
Solution Since we need to find all possible amounts invested in bonds and stocks, define the variables as
B: amount invested in bonds (in millions of dollars)
S: amount invested in stocks (in millions of dollars)
The retiree has a maximum of 1.2 million. Assuming that the retiree may not invest all of the money,
B + S < 1.2 million dollars
The return on each amount if found by multiplying the rates of return by the amounts. To earn at least 60,000 dollars,
0.03B + 0.08S > 0.06 million dollars
We can also assume that both amount cannot be negative so
B > 0 S > 0
Putting these inequalities together gives the system of inequalities,
B + S < 1.2
0.03B + 0.08S > 0.06
B > 0
S > 0
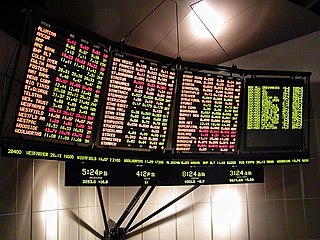
Graph the corresponding system of equalities.
Since (0, 0) is on the border of the region, let’s test the point (0.1, 0.1) in each inequality.

This corresponds to the solutions indicated below.

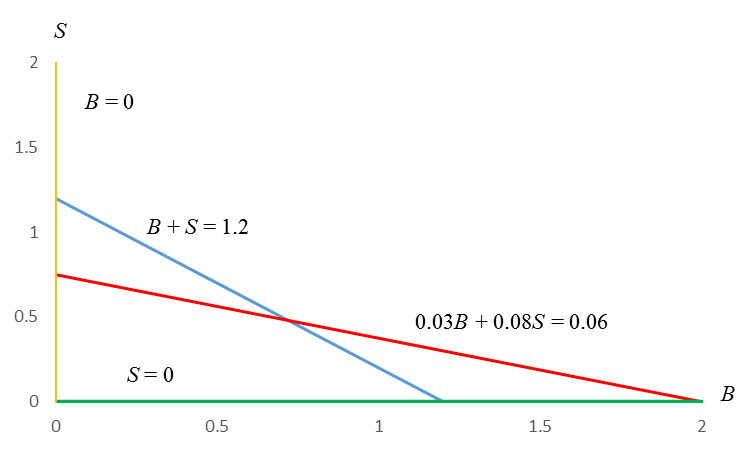
These solutions overlap in the triangular region below.
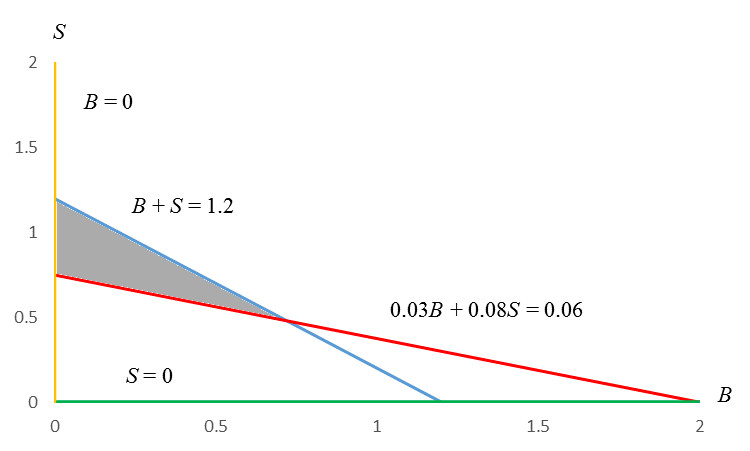
The corner points are located at the values labeled below.
 Any point in the region or on its border satisfies all of the inequalities in the system. Any point along the blue border means all 1.2 million dollars will be invested. In the gray portion, only a portion is invested. However, since points inside of the region are above the red border, the retiree will earn more than 60,000 dollars in returns.
On the red border, the retiree will earn exactly 60,000 dollars, but will not invest the entire amount. At the corner point (0.72, 0.48), the investor will invest 720,000 dollars in bonds and 480,000 dollars in stocks. At this point the retiree will also have exactly 60,000 dollars in returns.