Section 4.1 focused on graphing a system of inequalities to find the solution. This involved graphing each inequality and combining the graphs to find what is in common between each of the inequalities.
Although this process is a bit tedious, it is not incredibly difficult. The Application Quiz for this section focuses on the more difficult part…where does the system come from in the first place. There are a number of examples in Section 4.1 to help guide you. Let’s work through another example to augment those applications.
Problem A small brewery supplies two distributors in the Southwest US. One distributor needs at least 30 kegs each month and the other needs at least 50 kegs each month. The brewery can produce at most 100 kegs each month. Graph a system of inequalities that indicates all possible amounts that may be sent to each distributor. Label the corner points on the solution.
Solution As with all application problems, we need to start by defining the variables. What are we being asked to find? The question indicates that we are interested in “all possible amounts that may be sent to each distributor”. So define
x1: number of kegs sent to the first distributor each month
x2: number of kegs sent to the second distributor each month
Since the first distributor needs at least 30 kegs, we write down
x1 > 30
The second distributor needs at least 50 kegs so we write
x2 > 50
In each case, “at least” means that the variables must be larger than or equal to the number so a > is used.
The brewery can produce no more than 100 kegs per month. This means that the amount sent to distributor 1 plus the amount sent to distributor 2 must be less than or equal to 100,
x1 + x2 < 100
We also know that the number of kegs must be nonnegative. However, we do not need nonnegativity constraints since the first two inequalities imply that both variables will not be negative.
Let’s write the three inequalities down.
x1 > 30
x2 > 50
x1 + x2 < 100
To graph the solution to this system of inequalities, let’s look at the corresponding equalities.
x1 = 30
x2 = 50
x1 + x2 = 100
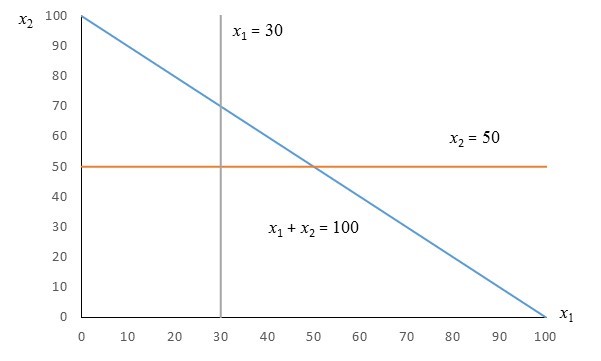
Each of these equations corresponds to a line. Let’s graph those lines with x1 on the horizontal axis and x2 on the vertical axis. There is nothing special about labeling this way. We could have also reversed the labels and solved the system.
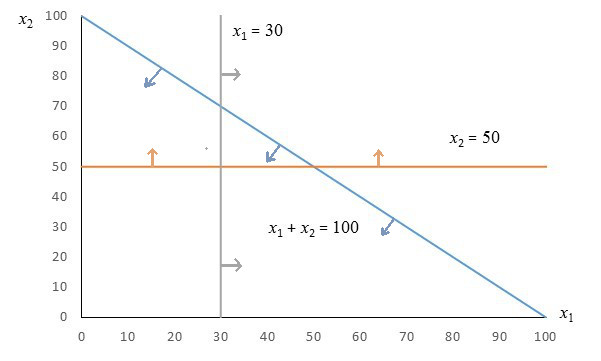
Now let’s test the point (x1, x2) = (0, 0) in each inequality.
Using this information, we can use arrows to indicate how the solutions for each individual inequality is shaded.
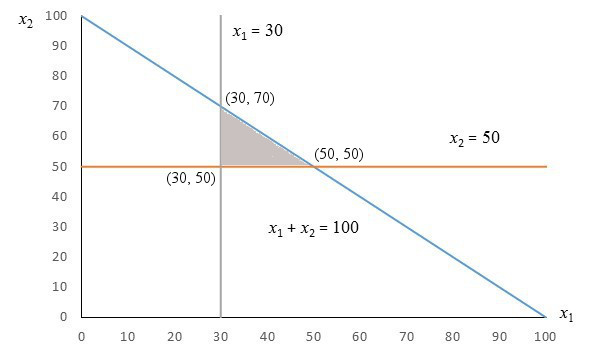
These shadings overlap in the triangular area in the center.
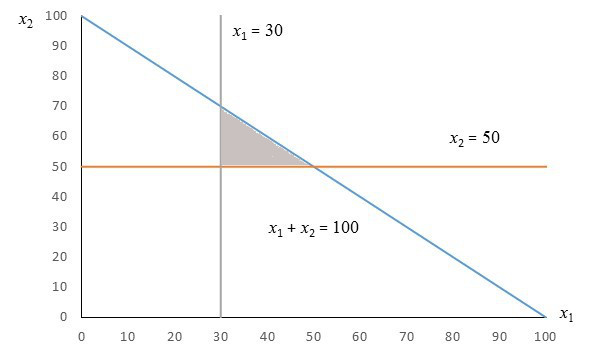
The solution to the system of inequalities is the shaded area. Using pairs of lines we can located the corner points.