
A number of you have asked me about alternatives to a TI graphing calculator. In addition to Excel, there are many online graphing tools available. If you have an Android phone or IPhone, there are a huge number of free apps that are available. I have had a hard time finding just one that does everything we need. Most will graph formulas, but may or may not graph data and fit data to lines. None of them work identically to a graphing calculator which makes them difficult to support. But luckily there is another option!
Another option is the website WolframAlpha (http://www.wolframalpha.com/). This website is the Internet’s leading computational engine. It can do just about anything. The trouble is knowing how to use it to do just about anything.

When you go to this website, you’ll see a box in which you can enter commands to help you do mathematics. The list of things you can do is HUGE. It is best to show some examples to get you started.
For instance, suppose you want to graph the function y = -5.686x + 676.173 in a window from x = 0 to x = 25. Enter the text you see below into WolframAlpha followed by Enter.
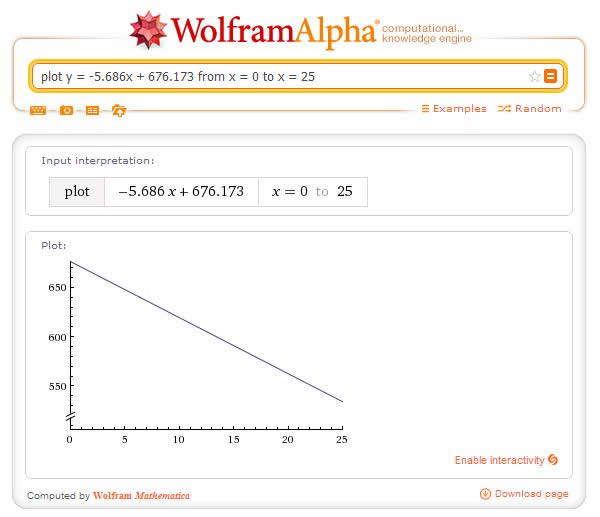 WolframAlpha makes a nice graph. If you want to graph two formulas simultaneously, add another formula with the word “and” as you see below.
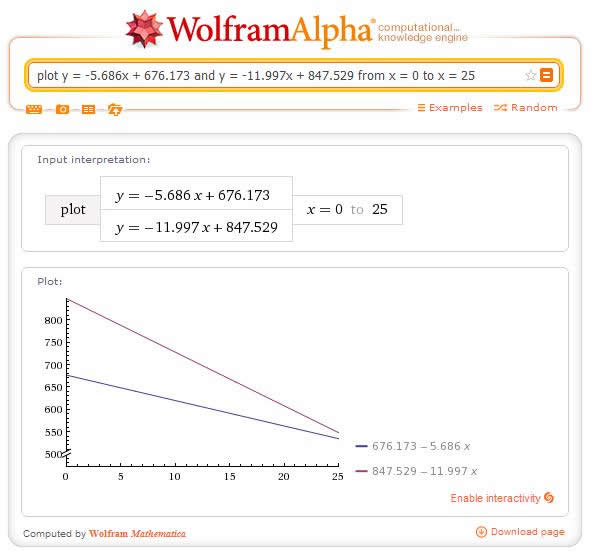
You can see that these lines are going to meet. To see this point of intersection, extend the graph by modifying the input to WolframAlpha as you see below.
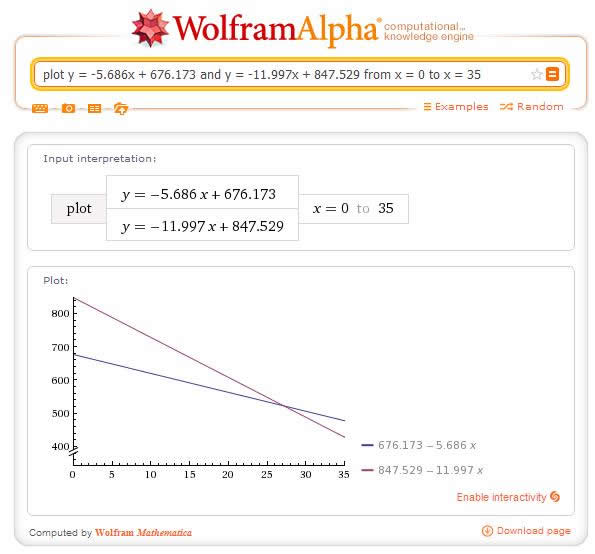
We can find this point of intersection by modifying the input to WolframAlpha with the command “intersections”:

Not only does it give a decimal…it also gives the exact answer in terms of fractions!
Often you are interested in evaluating the model above at a particular point. We can do this by clicking on the formula above. This will make WolframAlpha graph the formula by itself. Now add “where x = 20” on the command line and you will see:
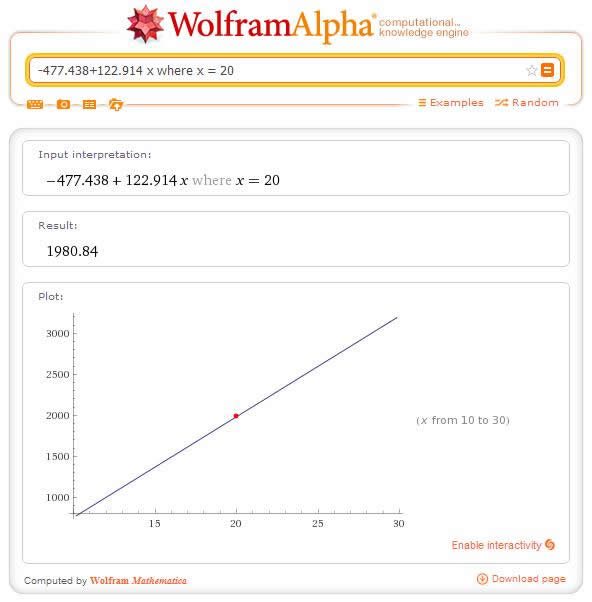
This gives the same output as TRACE on a graphing calculator. I’ll continue to make posts about WolframAlpha so those of you who do not have access to a graphing calculator have an alternative way to make graphs, calculate values, ect.