
One of the problems on the homework gave you three points on a line graph, (1905, 1024), (1955, 240), (2005, 1141). In these ordered pairs, the x value is the year and the y value is the number of immigrants (in thousands) to a large country.
- Find the average rate of change in immigration from 1905 to 1955 in immigrants per year.
- Find the average rate of change in immigration from 1955 to 2005 in immigrants per year.
- Find the average rate of change in immigration from 1905 to 2005 in immigrants per year.
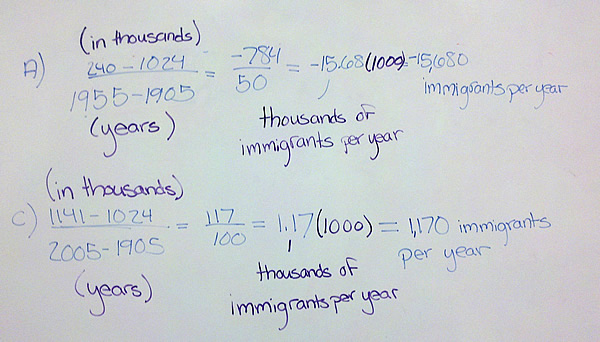
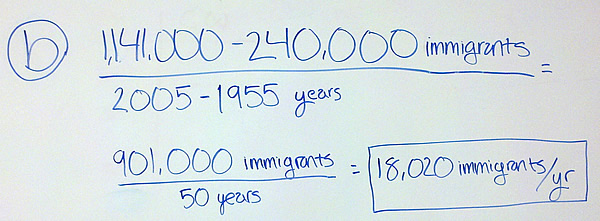
This problem illustrates the two ways that you can work in the “thousands” in the data to give immigrants per year instead of thousands of immigrants per year.