“NYSE Twitter Cover” by n.bhupinder is licensed under CC BY 2.0
Expected value is straightforward as long as you know all of the values of an experiment. If the values associated with each outcome are V1, V2, …, Vn and P1, P2, …, Pn are the corresponding probabilities, then the expected value is
E = P1·V1 + P2·V2 + … + Pn·Vn
This says that we need to multiply each value times the corresponding probability and then add up all of those products.
Let’s look at one example that can cause a little confusion.
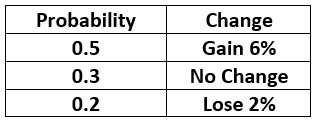
Problem Assume that you have $10,000 to invest in stocks. The likelihoods of how much the stocks will change are given in the table below.
What would be the expected gain or loss (in dollars)?
Solution There is a tendency to look at the table above and to interpret the first column as the probabilities and the second column as the corresponding values. This is partially true. The first column is certainly the probabilities. For the second column to be the values, they have to be in dollars. Instead they are percentages.
To fix this problem, we need to figure out what a 6% gain is in dollars. If we are investing $10,000, a 6% gain is 6% of $10,000 or
.06 ·10,000 = 600 dollars
Let’s now update the table to have probabilities and values.
Now multiply the probabilities and add the results:
E = 0.5 · 600 + 0.3 · 0 + 0.2 · -200 = 260
This means that if you make this investment over and over, you can expect to gain $260 each time you make the investment.


