
Graphing an absolute value function can be a bit deceiving. Depending on the technology you use, the graph you get may not actually represent the function well.
Let’s graph the function
using WolframAlpha and Desmos. These two online graphing tools are both free to use and can produce excellent graphs.
To graph this function in WolframAlpha, go to the website and type this in the box on the screen.
Both the numerator and denominator need to be in parentheses. The absolute value function in WolframAlpha is “abs”. Putting this in front of (x+4) means the absolute value of the quantity x + 4.
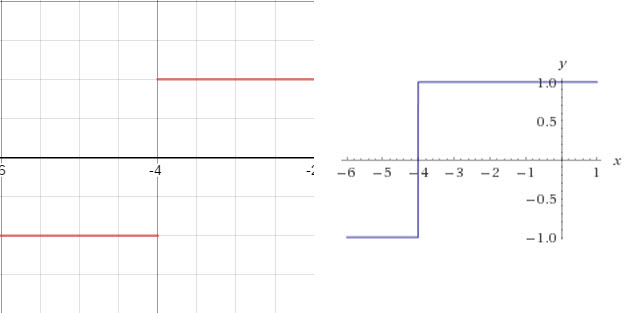
Press return to give the following result.

The graph consists of a horizontal section at y = -1 and another at y = 1. These sections are connected by a vertical line at x = -4. This is problematic since this is not a function…it does not pass the vertical line test at x = -4.
Let’s try graphing this function in Desmos.

As shown in the video above, the graph of this function looks like this in Desmos.

This looks similar to the WolframAlpha version, except that the tow horizontal pieces are not connected. As noted in the video,
is undefined at x = -4. This is because x = -4 causes the denominator to be zero.
This might not seem like a big deal. But if you were determining whether the function was continuous at x = -4, the two graphs would lead to different conclusions. The WolframAlpha graph would lead you to think the function is continuous. Desmos would give the opposite conclusion.
In this case, Desmos gives a more accurate graph since it shows the discontinuity at x = -4. An even better version of this graph would be to include open circles at x = -4.
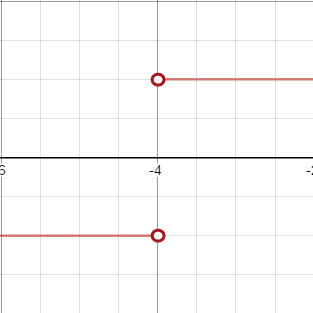
This not only shows the discontinuity, but also indicates that the function is undefined at x = -4. To put these on the graph I downloaded the image and then added the circles in an image editing program like Paint.