
![]() In an earlier post, I showed you how to find a piecewise function for Alabama state income taxes. Often you need a quick graph of the function…maybe something that WolframAlpha can do.
In an earlier post, I showed you how to find a piecewise function for Alabama state income taxes. Often you need a quick graph of the function…maybe something that WolframAlpha can do.
The function we want to graph has three pieces to it.
 We’ll use the plot command to make the graph, but we’ll also need to identify the pieces inside of the function. Do that with the following text:
plot piecewise [{{0.02x, 0<=x<=500},{0.04x-10, 500<x<=3000},{0.05x-40, x>3000}}]
The square and curly brackets are very important. Each piece and its domain is inside of curly brackets with a comma {???, ??? } and the pieces are also separated by commas. All of this goes inside of [{???}]. Doing this gives the following output.
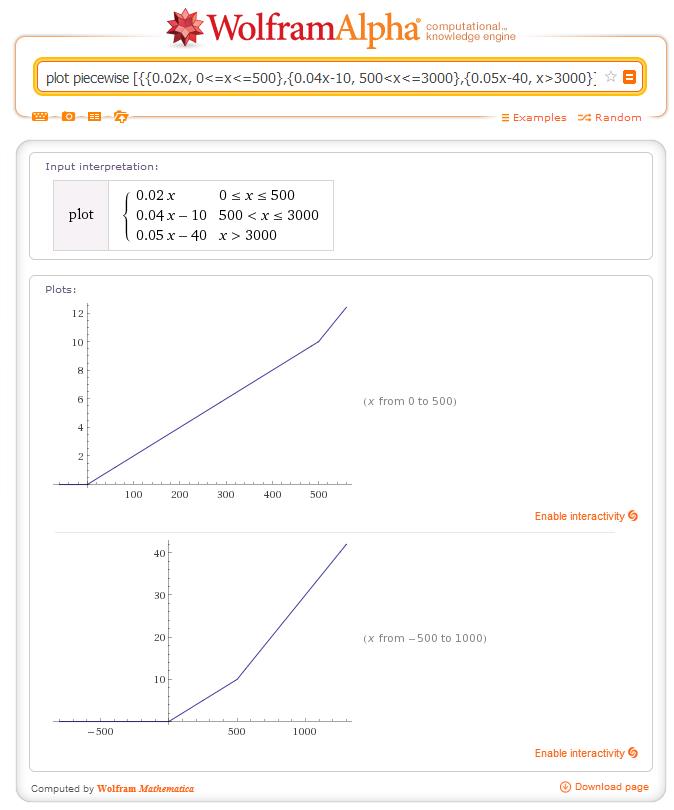 Two graphs are shown, but they are not quite right. They do not extend far enough to the right to show the third part of the function. To include that piece, add “from 0 to 5000” onto the command in WolframAlpha.
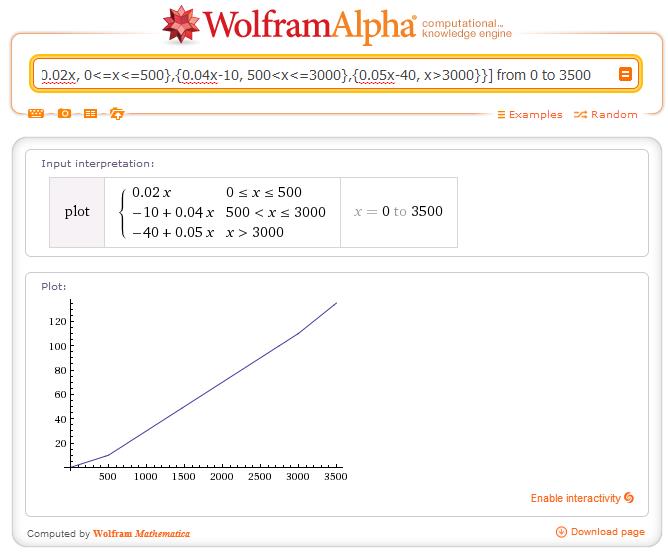
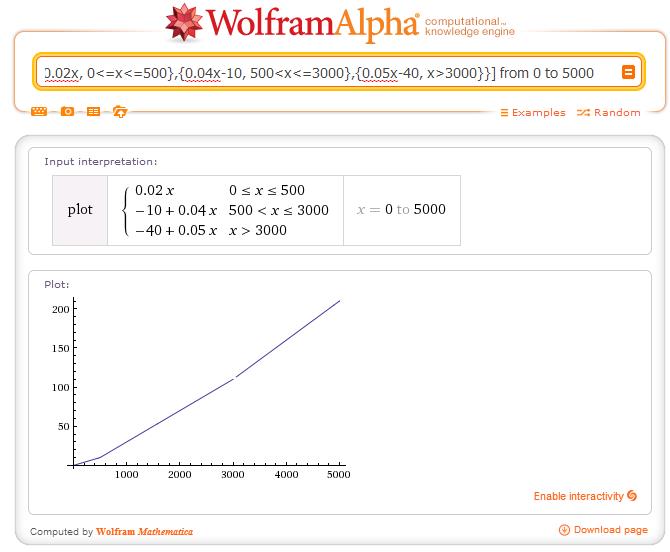 This shows all of the pieces, however there is a small gap in the graph where WolframAlpha did not connect the points. We’ll see later on that these points actually do connect in the function since it is a continuous function. By adjusting the domain, you might be able to make it look continuous. For instance, in a window from x = 0 to x = 3500, the piecewise function looks continuous.
How is that for cool?