
 In an another FAQ, I showed how to construct a piecewise function from a tax table on Arizona’s Form 140 Income Tax Form. Other states have descriptions of how income taxes are collected. In 2008, the following description was used to calculate state income taxes in Alabama.
- For the first $500 in taxable income, the tax rate on that income is 2%.
- For the next $2500 in taxable income, the tax rate on that income is 4%.
- On all additional income, the tax rate on that income is 5%.
Let’s use this information to construct a piecewise function T(x) for the income tax as a function of the taxable income x.
Let’s start by calculating the tax on a number if different taxable incomes. This helps us to understand the relationship between tax and taxable income. The tax on 400 in taxable income is
T(400) = 0.02(400) = 8
This is because 400 of taxable income falls in the first 500 of taxable income. In this case, the tax is 2% of the taxable income.
For 900 in taxable income, we need to take into account two tax rates. The first 500 of taxable income incurs a tax of 2%. The other 400 incurs a tax of 4%. Putting this together, the tax on the entire 900 is
T(900) = 0.02(500) + 0.04(400) = 26
Now let’s look at a taxable income that brings a third rate into the picture.
The tax on 4000 of taxable income comes from three tax rate: 500 at a 2% tax rate, 2500 at a 4% tax rate, and 1000 at a 5% tax rate. So the tax on 4000 of taxable income is
T(4000) = 0.02(500) + 0.04(2500) + 0.05(1000) = 160
These three taxable income levels indicate the process in each of three pieces in the piecewise functions. The three rate apply to certain ranges of taxable income, so start by writing the function as
This reflects the information on where the different tax rates apply.
To find the formula for each piece, it is easiest to simply find two point in each piece and calculate the equation of a line through those pieces. For instance, we already know that the point (400,8) is on the first section of the graph from part a. We also know that if a person has no income, they must pay no tax so (0,0) is also on this section. The slope between these points is
Since the graph passes through (0, 0), the vertical intercept is 0. Putting this information into the function gives
Now let’s look at the next section. Earlier we found that 900 in taxable income yields 26 of tax so (900, 26) is on the second section of the function. Further, we can also determine that taxable income of 3000 leads to a tax of
T(3000) = 0.02(500) + 0.04(2500) = 110
so (300, 110) is also on the second section. The slope between these points is
If we think of this section as having the equation y = 0.04x + b, we can find the value of b by substituting one of the ordered pairs into the function. This gives
 This yields the equation y = 0.04x – 10.
You can avoid using two points if you utilize the word description carefully. We know that the first 500 has a 2% tax and income above 500 (but below 3000) has a 4% tax. This means that for any taxable income x between 500 and 3000 has a tax of
Using these values in the tax function gives
Let’s use the two point strategy on the last section. We already know that (4000, 160) is on the third section of the function. A little math could also demonstrate that (5000, 210) is also on the graph. The slope between these points is
Does this surprise you at all? The slope is the tax rate for that section.
The vertical intercept is found by solving 210 = 0.05(5000) + b to give b = -40. With this information, we write the tax function as
The graph of this function is shown below.
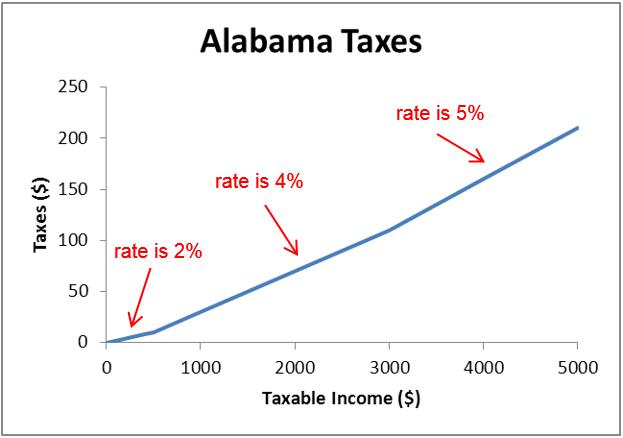
Notice that as the rate goes up, the graph gets steeper.