When we carry out probability problems, the first task is to identify the events in the problem. Often we can identify a few key events and then use compliments, “and”, or “or” . This can simplify and help us to represent the information pictorially.
The examples below illustrate this idea.
Example 1 Suppose that 6% of a certain batch of batteries provide inadequate current and 12% have defective labeling. Further testing indicates that 4% of the batch provide inadequate current and have defective labeling. If a battery is randomly selected from the batch, what is the probability that it will have adequate current and good labeling?
Several events run through this example:
Battery provides inadequate current
Battery provides adequate current
Battery has defective labeling
Battery has good labeling
We could associate each of these events with a different letter. However, we can use compliments of events and write
C: Battery provides inadequate current
C’: Battery provides adequate current
L: Battery has defective labeling
L’: Battery has good labeling
Instead of four separate events, we have two events and the corresponding compliments. In terms of these events, the data in the example may be written as
P(C) = 0.06
P(L) = 0.12
P(C and L) = 0.04
To help us visualize this information, let’s represent the events in a Venn diagram.
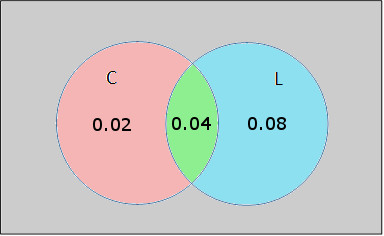
In this diagram, each event is represented with a circle. Since each event has some commonality, the circles overlap representing the batteries with inadequate current and defective labeling. Let’s go ahead and label this region as well as the other regions in color. We’ll also add the probability of a battery with inadequate current and defective labeling.
We are also given the fact that P(C) = 0.06. This means that the green region in the diagram along with the red region must total 0.06. This the red region must be labeled 0.02. Similarly, we can label the blue region with 0.08 so that P(L) = 0.12.
Let’s add these to the diagram.
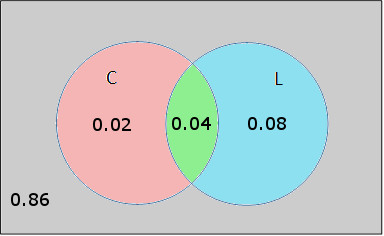
The question posed is about the probability of adequate current and good labeling. In terms of the events, we want to find P(C’ and L’). On the diagram, we need to know the probability of being out side of C and outside of L. This corresponds to the gray region on the diagram. Since the sum of all of the probabilities must be 1, the probability of the gray region is
P(C’ and L’) = 1 – 0.02 – 0.04 – 0.08 = 0.86
This probability may be added to give the diagram below.
With this diagram, we can answer almost any question regarding these events and probabilities…for instance, what would be the probability that only the current inadequate or that only the labeling is defective?
Example 2 The probability that a visit to a mechanic results in no diagnostic tests nor repairs is 35%. The likelihood that a visit results in diagnostic tests is 30% and the likelihood of repairs is 40%. Find the probability that a mechanics visit results in diagnostic tests and repairs.
Define the events
D: visit results in diagnostic tests
R: visit results in repairs
In terms of these events, “visit to mechanic results in no diagnostic tests nor repairs” is D’ and R’. In other words, to be in this event the visit must results in no diagnostic tests and at the same time result in no repairs. So P(D’ and R’) = 0.35.
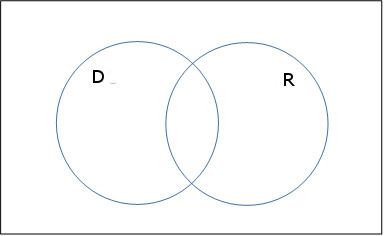
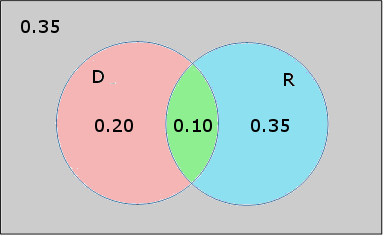
Let’s label this on a Venn diagram. Start with the two events.
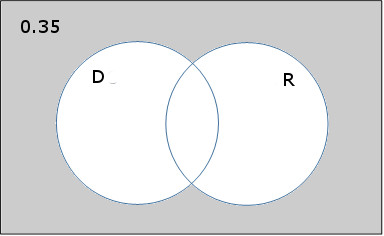
The event D’ and R’ is everything outside of the individual events.
If everything in the shaded area, D’ and R’, has probability 0.35, then the unshaded portion D or R must have probability 1 – 0.35 = 0.65.
Now that we know P(D or R) = 0.65, P(D) = 0.30, and P(R) = 0.45, we may use the union rule
P(D or R) = P(D) + P(R) – P(R and D)
to find the likelihood that the visit results in diagnostic tests and repairs. Putting in the values we get
0.65 = 0.30 + 0.45 – P(R and D)
or P(R and D) = 0.10. With this information we could correspond probabilities with all the parts of the diagram.


