
 I am a big advocate of using tree diagrams to solve problems involving conditional probability. However, some of these problems are easier to do if we reconstruct a frequency table from the probabilities in the problem.
Problem A doctor is studying the relationship between blood pressure and heartbeat abnormalities in her patients. She tests a random sample of her patients and notes the blood pressure (high, low, normal) and their heartbeats (regular or irregular). She finds that
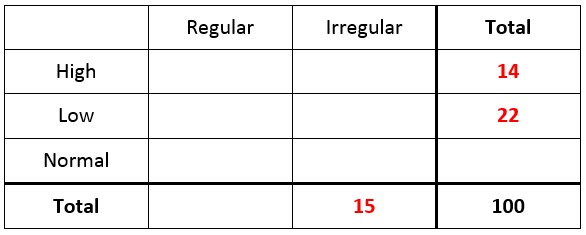
- 14% have high blood pressure
- 22% have low blood pressure
- 15% have an irregular heartbeat
- Of those with an irregular heartbeat, one-third have high blood pressure
- Of those with normal blood pressure, one-eighth have an irregular heartbeat
What portion of the patients selected have a regular heartbeat and low blood pressure?
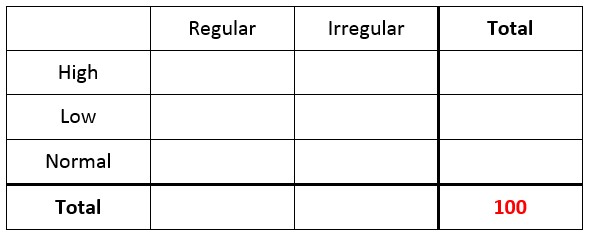
Start with a frequency table and a hypothetical total of 100 patients.
From the first three probabilities given in the bulleted list, we can add several frequencies to this table.
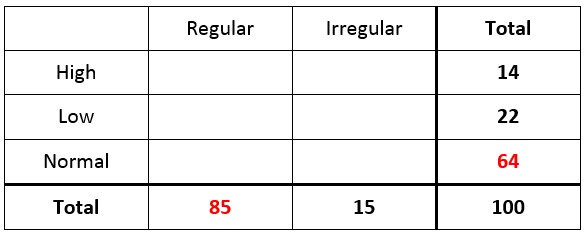
Since we are examining frequencies for 100 hypothetical patients, the total of high, low, and normal blood pressure must be 100. This means that there must be 64 patients with normal blood pressure. Similarly, there must be 85 patients with regular heartbeat. Let’s add these frequencies to the table.
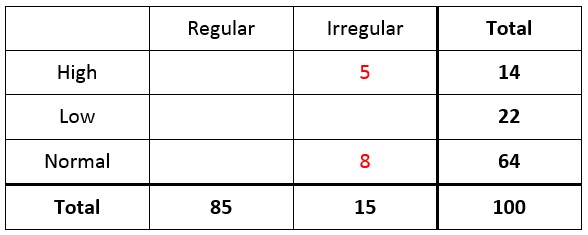
Now let’s examine the two conditional probabilities in the bulleted list. We know that “Of those with an irregular heartbeat, one-third have high blood pressure”. Since 15 have irregular heartbeat, that means that 5 must also have high blood pressure.
Similarly, “Of those with normal blood pressure, one-eighth have an irregular heartbeat” tells us that one-eighth of 64 patients or 8 patients must also have irregular heartbeat. Let’s add those values to the table.
The sum of the frequencies in the irregular column is 15, the irregular heartbeat and low blood pressure frequency must be 2 patients. The entries in the regular heartbeat column can be calculated to make sure the proper sum occurs in the last column.
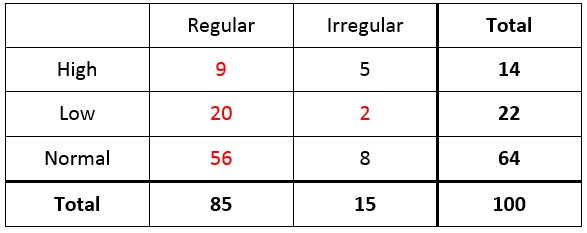
To find what portion of the patients selected have a regular heartbeat and low blood pressure, locate the frequency of patients with regular heartbeat and low blood pressure. This frequency, 20, is divided by the total number of patients, 100, to give the portion 20/100 or 20%.