
 Here is an example of how computing a limit tells you something interesting about a model.
A student to teacher ratio is computed by dividing some number of students by a corresponding number of teachers. For instance in 2001-2002, there were 47,664,934 students taught by 2,800,790 teachers.
The student to teacher ratio in this school year was
From 2001 through 2007, the number of teachers increased in the United States as the number of students also increased. Over this time period, the number of teachers in the US may be modeled by
![]()
where t is the number of years since 2000. At the same time, the number of students in US schools increased according to the model
![]()
We can model the student to teacher ratio by dividing the model for students by the model for teachers,
Since the millions in millions of students per millions of teacher reduces, the ratio is in students per teacher. Let’s examine the graph of this function.
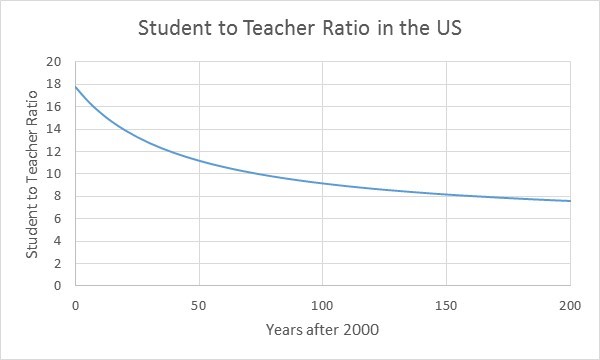
As the years go by, the ratio is dropping. However, is there a limit to how low the ratio can drop? Will the ratio drop all the way to zero or level off to some non-zero value?
To determine the answer to this question, we need to take the limit of the ratio model as t approaches ∞,
This limit is computed by dividing each term in the ratio by t and examining what happens to the resulting pieces as t approaches ∞:
As the years go by, the student to teacher ratio will get closer and closer to 5.3 students per teacher. This assumes that the linear models used in the ratio will continue to be valid for all times.
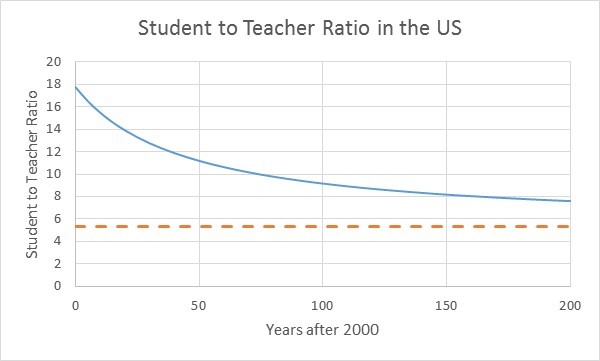 The level may be graphed with the model as shown above. This dashed line is called a horizontal asymptote. It indicates how the function behaves for very large values of t. Notice that the student to teacher ratio does not approach the level of 5.3 (orange dashed line) very fast. Most likely the grow of teachers or students will change from the linear models used to construct the function in this length of time. This would cause the model to change slightly and perhaps move the horizontal asymptote. This graph shows what would happen if the model was valid in the long term…along the scale of hundreds of years.