
Many standard maximization problems may be solved graphically or with the Simplex Method. If your problem has two independent variables (like x and y or x1 and x2), you have a choice of which technique to utilize. However you do it, the solutions should be the same. Let’s look into this.
Maximize z = 5x1 + 2x2 subject to
2x1 + 4x2 < 15
3x1 + x2 < 10
x1 > 0, x2 > 0
Let’s look at the two solutions.
First off, here is the solution using a graphical approach.
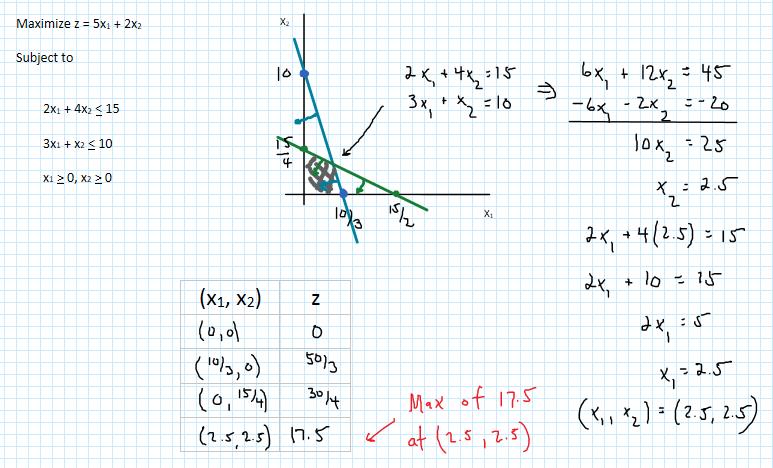 In this solution, the feasible region is graphed using the inequalities. The corner points of the region are then tested in the objective function to find the maximum.
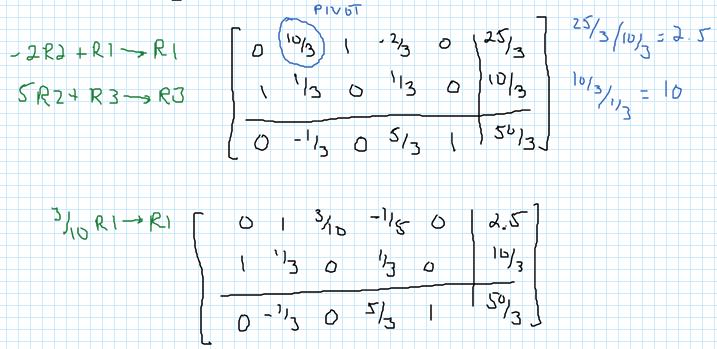
Now let’s look at the same problem solved with the Simplex Method.
First the problem needs to be written with slack variables and put into a matrix. Then the pivot is identified and row operations are used to change the pivot to a 1.
 Once the pivot is a 1, the rest of the pivot column is filled with 0’s using row operations. Since the bottom row has negatives in it, another pivot is selected.
 As before, the pivot is changed to a 1. Then the rest of the pivot column is changed to 0’s.
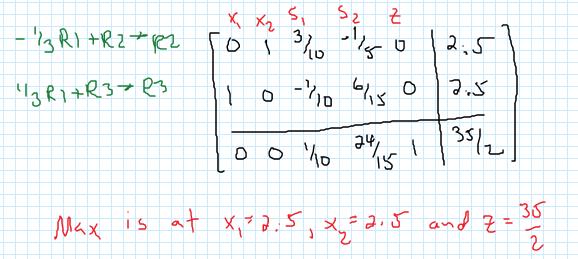 After these operations, there are no longer any negative numbers in the bottom row so we can read the solution off of the matrix. The solution, x1 = 2.5, x2 = 2.5 and z = 17.5, is the same as the graphical solution.
For problems with two independent variables, the linear programming problem can be found graphically and with the Simplex Method. For problems with more independent variables, the graphical method may not be applied so the Simplex Method becomes the best choice.