
 As I described before, John Medina plans his lectures around four principles.
- Emotions get our attention.
- Meaning before details.
- The brain cannot multitask.
- The brain needs a break.
With these in mind, he plans each class meeting in ten minute segments. That is about the maximum amount of time that the brain can pay attention before it wanders off on its own. This ten minute segment covers one core concept. The core concept is chosen so that it can be fully explained in one minute. Then the other nine minutes in the segment may be used to explain how the detail relates to the core concept in simple, direct way.
By making direct connections with the core concept often, the brain does not have a chance to start asking, “What is the point?” or “How is this useful?” Pondering these questions while trying to pay attention to the lecture is multitasking…we need the learners to avoid this type of behavior. When the meaning is provided in the first minute followed by details, the brain is able to build a hierarchical structure of the core concept. The brain want to know why and segments give it exactly what it wants. Constantly providing the connections helps the brain to stay focused on the lecture.
 Once a segment is complete, Medina needs to get the attention of his students again. Their attention is dropping rapidly. Simply continuing the lecture would be like talking into a a two way radio I found on the side of the road. It seemed to work when I turned it on. But if the another two way radio is not turned on and on the right channel, anything I might try to communicate would be lost.
As Medina says in Brain Rules,
What do they need? Not more information of the same type. That would be like geese choking on the food with no real chance to digest. They also don’t need some completely irrelevant cue that breaks them from their train of thought, making the information stream seem disjointed, unorganized, and patronizing. They needed something so compelling that they blast through the 10-minute barrier and move on to new ground-something that triggers an orienting response toward the speaker and captures executive functions, allowing efficient learning.
Medina uses “emotionally competent stimuli” or ECS to hook his students into another 10 minutes of attention. His hooks have the following characteristics.
- Hooks trigger emotion.
- Hooks are relevant.
- Hooks go between segments.
Using these characteristics, he is able to keep the attention of his students through a 50 minute lecture.
A neurologist like John Medina has a wealth of interesting information at his disposal. Everybody has a brain! Everybody is interested in how it works and how it can work better. But mathematicians have their work cut out. In many classes, we hear students every semester say, “I have never been good at math.” It is as if they are making excuses before they even get started.
I employ a flipped classroom where students do a lot of work outside of class. This opens up the lecture time in class to more active forms of learning. Students are often reluctant to participate and prefer their zombie learner roles over active roles in the classroom. Since these active forms of learning are based on Medina’s Brain Rules, I use Medina’s Brain Rules as a hook. This is what motivated me to look for the “tells” I mentioned earlier.
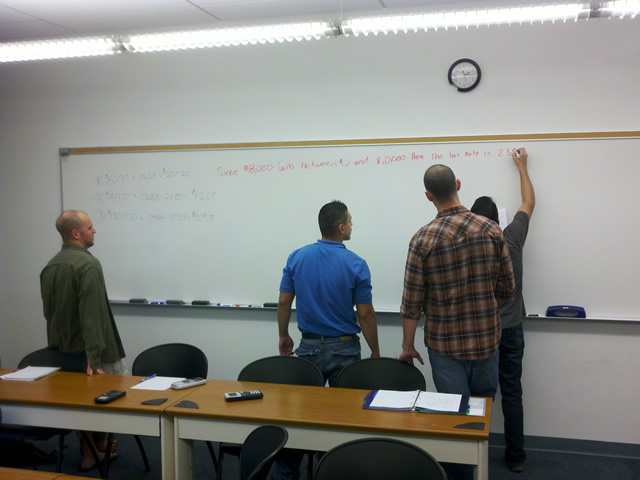 Many of the 10 minute segments I have students participate in amount to what I call collaborative board work. Using an online homework system, I am able to diagnose what topic they are having trouble with prior to class. In class, I send the students to the white board in groups to do similar problems. Working together allows students to make mistakes and correct them in a nonjudgemental forum.
It also follows Brain Rule #1, “Exercise boosts brain power.” Working at the board forces students to move around in the classroom…it is what Medina calls “cognitive candy”.
Let me give you an example of one of my favorite ten minute segments and the hook Iuse to introduce it. I start by handing out the worksheet below.
As I hand it out, I ask how many of them have a wireless phone through Verizon. In most classes, a good half to three-quarters of the class have Verizon phones. If so many people use Verizon, would it make sense that Verizon might be a good investment? Generally a lot of the students nod their heads in agreement. At this point, I have peaked their curiosity and I talk a little bit about owning stock in publicly traded companies. before you invest, you must analyze the company’s corporate reports to ensure the company is growing leading to dividends or increasing profits.
Verizon’s growth is dependent on the growth of its revenues and the number of customers. This worksheet let’s you calculate the rate at which revenue and subscribers is growing over time.
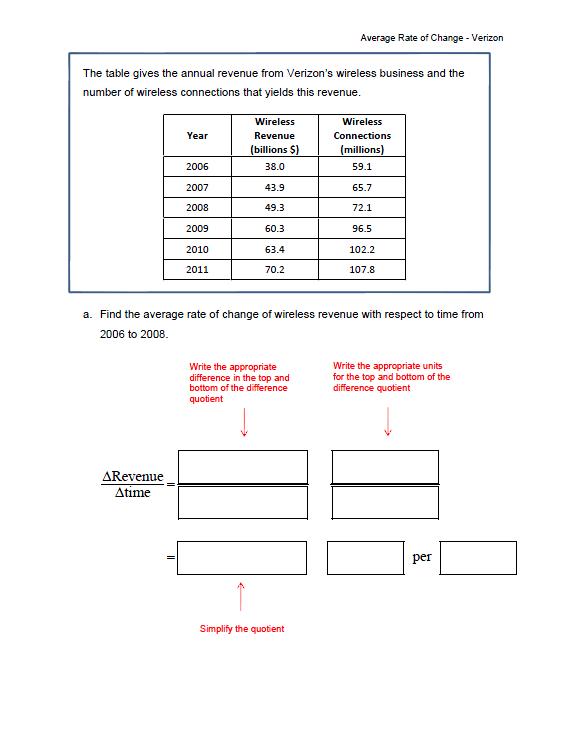
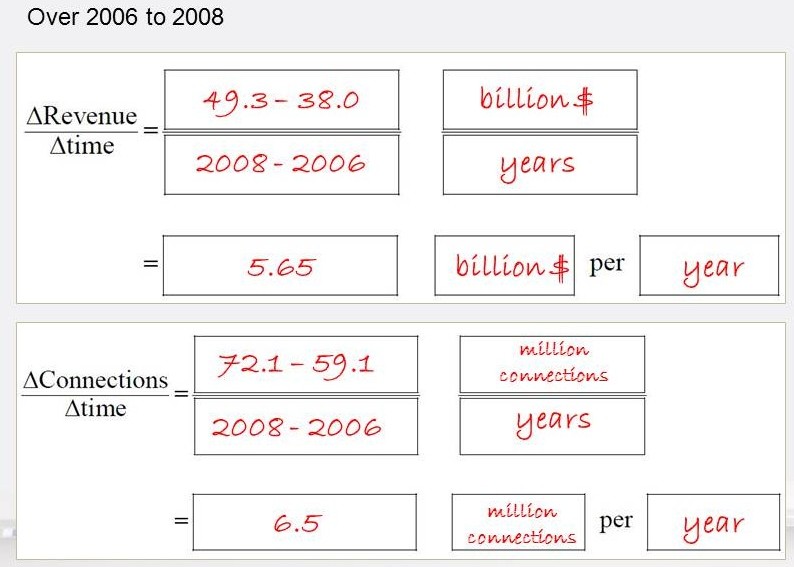
On the first page, students are given instructions in red to help them calculate the appropriate changes in revenue and time. Usually they ask if this is like calculating slope and I say “Yes!” After a few minutes, they have filled out the first two pages of the worksheet. I often assign different time periods to different groups. From 2006 to 2008, the revenue and number of connections are increasing (the rates are positive).
 Now let’s look at 2008 through 2011.
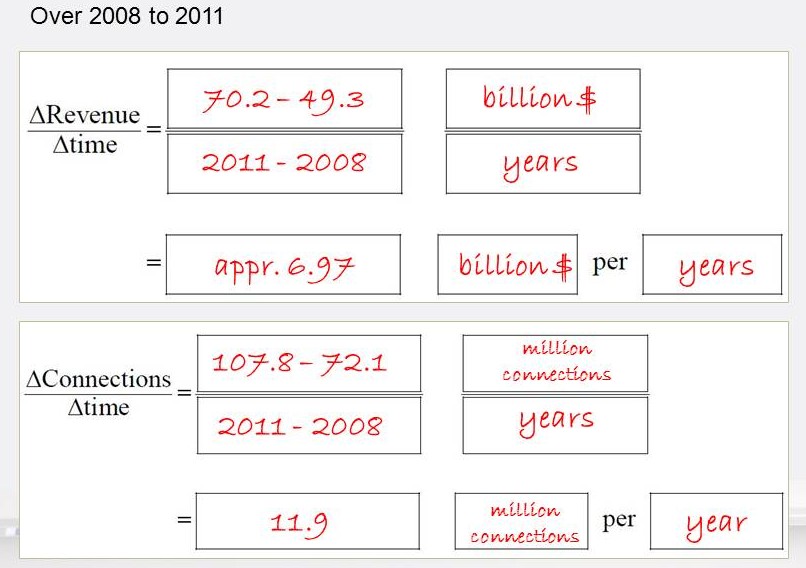 The revenue and connections are still increasing, but now they are increasing even faster. The revenue went from 5.65 billion dollars per year to 6.97 billion dollars per years. The corresponding numbers of connections are also getting bigger…going from a rate of 6.5 million connections per year to 11.9 million connections per year.
Is Verizon starting to look like a good investment? The revenue is growing faster and faster and the connections are growing faster and faster. Call my broker!
But this is not the whole story. Now I have the students calculate the rate at which revenue is changing as the number of connections changes. Here are the numbers they get.
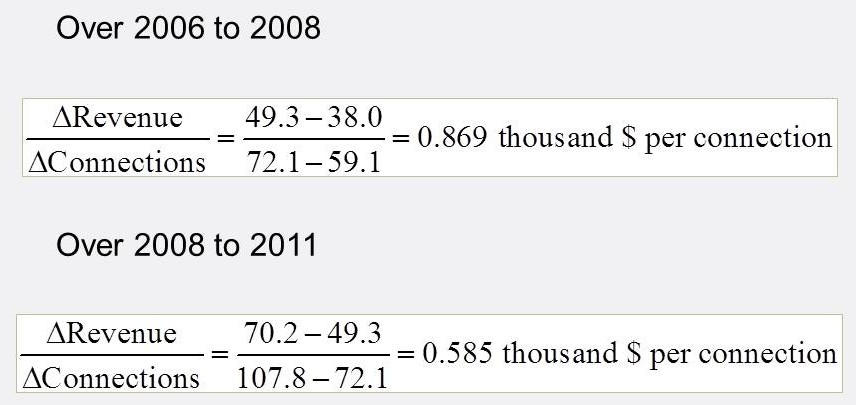 Over 2006 to 2008, revenue is changing with respect to connections at a rate of 0.869 thousand dollars per connection or $869 per connection. This means each additional connection increases revenue by $869. That seems like a reasonable number considering how much each of us spends per month on our wireless bill.
But over the following period, 2008 through 2011, each additional connection yields only $585 in additional revenue!
Is the hook for this activity emotionally charged ? Yes! Students are always surprised that revenue and connections are growing, but the company might not be the best investment.
I this activity relevant? Yes! I use this activity in a Business Calculus class to introduce rates of change. This audience usually has a predisposition to material from business. They want to know how they could apply calculus in their careers. I have also used it in College Algebra successfully. The activity preys upon their desire to make money. Its relevancy grabs their attention and keeps it. As Medina says,
The more a learner focuses on the meaning of the presented information, the more elaborately the encoding is processed. This process is so obvious that it is easy to miss. What it means is this: When you are trying to drive a piece of information into your brain’s memory systems, make sure you understand what that information means. If you are trying to drive information into someone else’s brain, make sure they know what it means.
The directive has a negative corollary. If you don’t know what the learning means, don’t try to memorize the information by rote and pray the meaning will somehow reveal itself. And don’t expect your students will do this either, especially if you have done an inadequate job of explaining things. This is like looking at the number of diagonal lines in a word and attempting to use this strategy to remember the words.
This activity incorporates the meaning first, then moves on to details as the activity evolves. At the end of the activity, students know exactly why rates are important. The details need to be filled in to show them how to calculate similar rates when the information is given in different forms…graphs, formulas, ect.