
In this post, I’ll demonstrate how we can use y = mx + b to find equations of lines. No need to memorize other equations of lines…it is easier to focus on the data given to us an use it to find m and b.
Author: Dr Dave
How Do You Find Statistics from Frequency Data?
 Working with frequency distributions to find the mean, variance, and standard deviation can be a little tough. In the example below, we’ll incorporate Sheets (or Excel) to make it easier to calculate these statistics. An example is worked out in Example 3 of Question 2 in Section 6.2 for the mean and in the video below for standard deviation.
Let’s look at how we can implement this process in a spreadsheet.
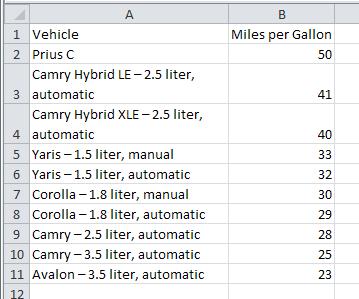
How Do You Find a Population Mean with a Spreadsheet?
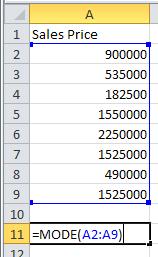
How Do You Find the Mode of a Dataset?
How Do You Compute the Sample Mean or Variance in a Spreadsheet?
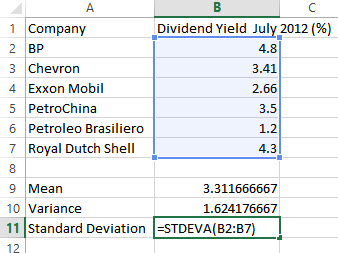
Both Excel and Sheets use the same commands to calculate a sample mean, sample variance, or sample standard deviation. This FAQ demonstrates how to use these commands.