How Do I Find The Equation Of A Line That Passes Through Two Points?

In many linear application problems, you needed to write the given information as ordered pairs and then find the equation that passes through the ordered pairs. Here is a similar example that use p = mt + b instead of y = mx + b.

Problem The percent of births to teenage mothers that are out of wedlock can be approximated by a linear function. In 1960, the percentage was 15% and in 1996 the percentage was 76%.

Use this information to find a linear model for the percentage of births as a linear function of the number of years since 1950.

Solution Since the problem statement specifies a linear function of the number of years since 1950, the input to this function is years since 1950 and the output is the percentage. The information in the problem can be written as ordered pairs (10, 15) and (46, 76).


Define the variables for these quantities as

t: years since 1950

p: percentage of births to teenage mothers out of wedlock

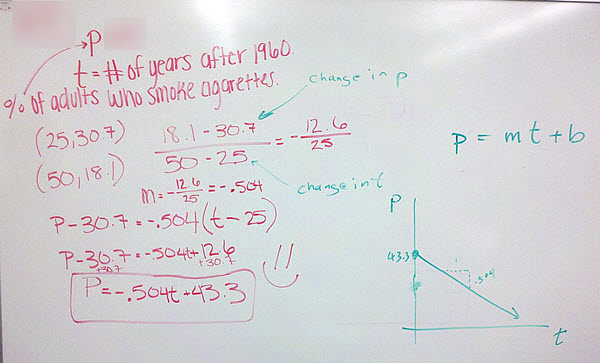
This means the form of the linear function is p = mt + b. The slope of a line passing through these points is

The slope is written as a fraction so no rounding occurs. Writing this as a decimal and rounding the amount would lead to a line that does not pass through the points. With this slope, we know the equation of the line is . To find the value of b, substitute one of the ordered pairs into the equation and solve for b.

This makes the linear function,

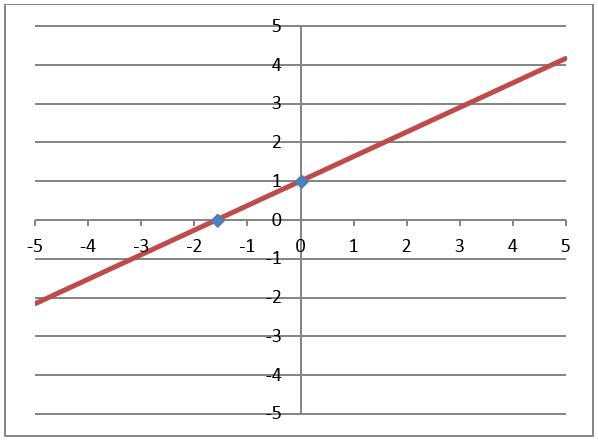
Adding this to the graph yields the proper line.

How Do You Find The Equation Of A Line?

In this FAQ, I’ll demonstrate how we can use y = mx + b to find equations of lines. No need to memorize other equations of lines…it is easier to focus on the data given to us an use it to find m and b.

Let’s look at the most basic example that illustrates this process.

a. Find the equation of a line through the point (4, -6) with slope – 3/4.

Start by substituting m = -3/4  in the slope-intercept form to yield

y = – 3/x + b

Now substitute the point into the line by setting x = 4 and y = -6. This leads to

Using this value for b in the slope-intercept form above give the line y = –3/4 x -3. The answer to the problem is the equation of the line with the appropriate values for m and b.

Now let’s complicate matters a bit by finding the equation of a line passing through two points.

b.  Find a line through the points (-1, 3) and (2, 6).

The slope through the points is

Substitute the slope into the slope-intercept form to give

y = x + b

Now take one of the points and substitute it into this equation. Using the ordered pair (2, 6), we can solve for b:

This gives us the equation y = x + 4.

In both of these examples we applied the same strategy of putting in the slope m and then solving for the intercept b.

Now let’s look at a problem whose wording might throw you off.

c.  Find a line with x-intercept of -5 and a y-intercept of 4.

Don’t let the fact that they talk about intercepts throw you off the strategy. These intercepts can be written as ordered pairs (-5, 0) and (0, 4). The slope between these points is

This leads to the line

y = 4/5 x + b

Since the y-intercept is 4, we can substitute it into this line for b to give y = 4/5 x + 4 .

This problem is even easier since the y intercept was given to us. In each case we can start from y = mx + b and then find the value of m and b.

How Do You Find a Linear Model from a Rate

In another MathFAQ,  I examined how we can find the equation of a line from two data points. In this post I want to look at a closely related problem where we find the equation of the line from a rate.

Problem Assume the growth of the population of Del Webb’s Sun City Hilton Head community was linear from 1996 to 2000, with a population of 198 in 1996 and a rate of growth of 705 people per year.

a. Write an equation for the population P of the community where x is the number of years after 1990.

Solution The population of 198 in 1996 corresponds to the point (6, 198) since the variable x corresponds to years after 1990. We’ll write the slope-intercept form of the line, P = mx + b, and substitute m into the equation. The rate of growth, 705 people per year, is the slope of the function. Therefore, the line describing the population is

P = 705x + b

To find the value of b, we need to substitute x = 6 and P = 198:

198 = 705(6) + b

-4032 = b

This gives us the equation,

P = 705x – 4032

b. Use the function to estimate the population in 2002.

Solution The year 2002 corresponds to x = 12. Substitute this value into the function to yield

P = 705(12) – 4032 = 4428

The population in 2002 will be 4428 people.

c. In what year will the population reach 10,000?

Solution In this part, set P = 10,000 and solve for x.

10000 = 705x – 4032

14032 = 705x

14032/705 = x

19.9 ≈ x

This corresponds to 1990 + 19.9 = 2009.9. So in the year 2009, the population will reach 10000. Since we are asking in what year, we DO NOT round up on the answer.

How Do You Find the Equation of a Line From an Application?

Below are some problems that students solved on the board in previous semesters. All of them start from the slope-intercept form of a line and require you to find the slope m from two points and then solve for b. Click on the pictures to see a larger version.

Problem The percent p of adults who smoke cigarettes can be modeled by a linear equations p = mt + b, where t is the number of years after 1960. If two points on the graph of this function are (25, 30.7) and (50, 18.1), write the linear equation of this application.

Solution


Problem The number of women in the workforce, based on data and projections from 1950 to 2050, can be modeled by a linear equation y = mx + b. The number was 18.4 million in 1950 and is projected to be 81.6 million in 2030. Let x represent the number of years after 1950 and y be the number of women in the workforce in millions.

a. What is the slope of the line through (0, 18.4) and (80,81.6)?

b. What is the average rate of change in the number of women in the workforce during this time period?

c. Use the slope from part a and the number of million of women in the workforce in 1950 to write the equation of the line.

Solution

How Do You Interpret A Linear Model?

Linear model are not always given in a nice slope-intercept form. If they were, it would be easy to read the slope and y-intercept off the y = mx + b form. In the example below, you are given a linear model in general form, ax + by = c. However, the letters are p and x instead of x and y.

Problem The percent p of high school seniors using marijuana daily can be related to x, the number of years after 1990, by the equation 30p – 19x = 30.

a. Find the x-intercept of the graph of this function.

Solution To find an intercept, we need to set the other variable equal to zero. In this case, to find the x-intercept, we need to set p = 0:

b. Find and interpret the p-intercept of the graph of this function.

Solution To find the p-intercept, set x = 0:

Since x corresponds to years after 1990, this tells us that in 1990 the percentage of seniors using marijuana daily was 1%.

c. Graph this function, using the intercepts. What values of x on the graph represent the years 1990 and after?

Solution Put the two points we have found on a graph.

Since 1990 and beyond correspond to x values 0 and above, a better viewing window would be one like we see below.

Notice that with each axis labeled, it makes more sense to use non-negative x values ( 0 and greater).

d. Use this model to determine the slope of the graph of this function if x is the independent variable.

Solution We could use the points we found earlier to calculate the slope, but it is easier to change the equation into slope-intercept form and read off the slope. To do this, we’ll need to solve 30p – 19x = 30 for p:

Since this is in the slope-intercept form p = mx + b, the slope is 19/30 or approximately 0.63. The line we drew above also makes sense since it has a positive slope and a vertical intercept of 1.

e. What is the rate of change of the percent of high school seniors using marijuana each year?

Solution The rate of change is the slope, with the appropriate units attached. In this case, the units are

So the percent of students using marijuana is rising at a rate of 19/30 percent per year. Since 19/30 is approximately .63, this means that each year the percentage increased by about .63%.


Interpreting this model means we examined the intercepts and their meaning as well as the slope and what it tells us about the percent using marijuana and the years since 1990.