The Section 7.3 Homework contains problems about Bayes’ Theorem applied to medical testing. Let’s look at some resources to help you understand this type of problem.
A stock brokerage is grading its trainees by evaluating their stock picks over a 6 month period. The company has analyzed the trainees’ stock portfolios and computer usage to determine that 60% of the stocks picked by the trainees were up in the 6 month period and 45% of the trainees do research on their stock picks. In addition, the brokerage determined that of the stocks that were up, 30 of the trainees picking a particular stock did research on the stock and 30 of the trainees picking a particular stock did not do any research on the stock.
By Dipsey, via Wikimedia Commons
If a trainee buys the stock of a company they have researched, what is the likelihood that the stock was up over the 6 month period?
Before we start calculating haphazardly, let’s define two events for the problem:
S is the event that a stock that was picked by a trainee was up
R is the event that a trainee did research on a stock that they picked
In terms of these events, we need to find the probability P(S | R), the probability that a stock picked by a trainee was up, given that that stock pick was researched by the trainee. Now let’s examine the information in the problem statement.
The statement says, “60% of the stocks picked by the trainees were up in the 6 month period.” This information is given as a percentage so it corresponds to an empirical probability. In terms of the event S, it tells us that
P(S) = 0.60
The statement also says, “45% of the trainees do research on their stock picks.” This information relates to the event R and tells us that
P(R) = 0.45
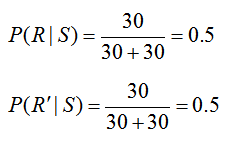
The statement “the brokerage determined that of the stocks that were up, 30 of the trainees picking a particular stock did research on the stock and 30 of the trainees picking a particular stock did not do any research on the stock” relates the events S and R. By saying that “of the stocks that were up”, we are establishing that the following information corresponds only to stocks picked by the trainees that are up or that the information matches a conditional probability where we are given S. Additionally, we know that a total of 60 trainees picked stocks that were up since of the stocks that were up, 30 trainees did research and 30 did not do research. Based on this information,
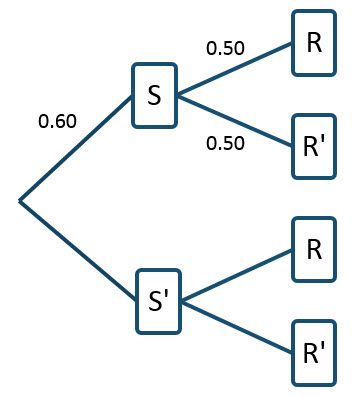
On a tree diagram, we can label the branches as shown.
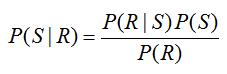
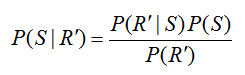
For this particular way of constructing the tree diagram, the probability P(R) = 0.45 cannot be labeled on the diagram directly. Remember, we are looking for P(S | R) which is NOT the same as the probability P(R | S) = 0.5. To relate these conditional probabilities, utilize Bayes’ Rule in the form,
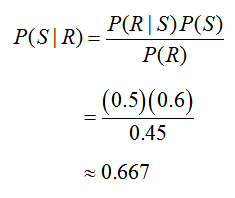
Solving for P(S | R), we get
Each of the probabilities on the right side we have already found and can be substituted to yield
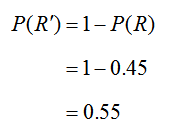
This number does not have much meaning unless we compare it to the likelihood of picking a stock that is up, given that the trainee did not do any research on the stock, . Using Bayes’ Rule in this case yields
The only probability that we have not calculated is P(R′). Using the compliment rule, this is easily calculated as
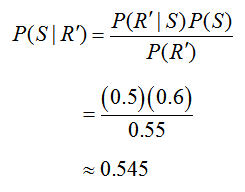
Now we can return to Bayes’ Rule to calculate
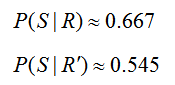
In summary, we now know that
Now we can compare these two probabilities to draw conclusions about the events. Based on these numbers, we see that it is more likely that a stock chosen by a trainee goes up provided the do research. The probabilities P(S ′ | R) and P(S ′ | R′) can be found with similar versions of Bayes’ Rule.
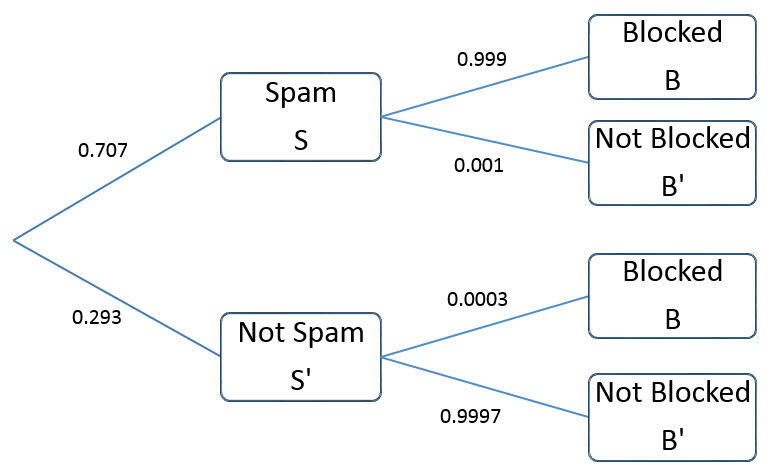
It might surprise you to know that in 2013, 70.7% of all worldwide emails were spam. Spam emails are unsolicited email that are sent out in bulk. To combat these emails, companies utilize spam filters provided by software companies to block the spam emails from reaching the desired recipient.
One provider, SpamTitan, advertises the following data
It blocks 99.9% of all spam email.
It blocks 0.03% of all emails that are not spam.
Based on the information above, what is the probability that a delivered email is spam?
To start a problem like this, let’s identify the relevant events.
S is the event that an email is spam
S ′ is the event that an email is not spam
B is the event the an email is blocked
B′ is the event an email is not blocked
Based on these events, we want to compute the probability that an email is spam given that it is not blocked, P(S|B′).
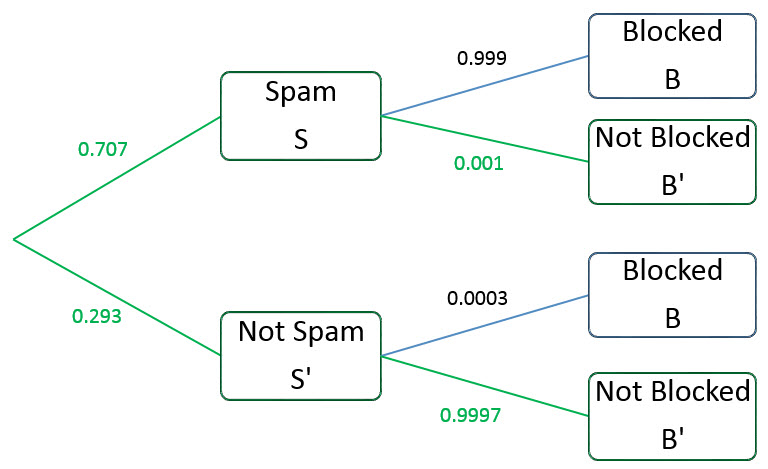
Let’s look at a tree diagram of the situation.
Next, we’ll label the given information on the diagram.
The key here is to recognize that the data provided by the software company are conditional probabilities. Since we know that the probabilities on branches from a single point must add to 1, we can finish labeling the diagram.
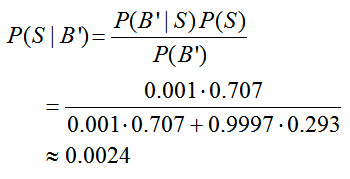
The diagram is labeled nicely, but none of the probabilities match P(S|B′). The conditional probabilities on the second set of branches are all given the event S or the event S ′. To find P(S|B′), we’ll utilize Bayes’ Rule. Start with the relationship between conditional probabilities,
and solve for P(S|B′). This gives
All of the probabilities on the right side may be found from the tree diagram.
The probabilities in the numerator are located along the branch in red through S and B′.
The probability in the denominator corresponds to all branches in green that lead to B′. Since the events along each branch are disjoint, the probabilities for each branch add. This gives us
So the likelihood that an unblocked email is spam is 0.24%.
Users are typically very tolerant of getting spam that has made it through a spam filter. However, they are not very tolerant of blocked emails turning out to not be spam. This probability is P(S′|B). We can compute this probability in a similar manner:
This likelihood equates to 0.012%. This should make customers very happy since it means that there important emails will rarely be blocked by the spam filter.
It easy to confuse conditional probability with probability of an intersection of two event. They are related! The probability of an event A given that event B has occurred is
The vertical bar | means “given” and the event after it is the event that has already occurred.
Let’s look at some data to determine how to find several different probabilities including conditional probability.
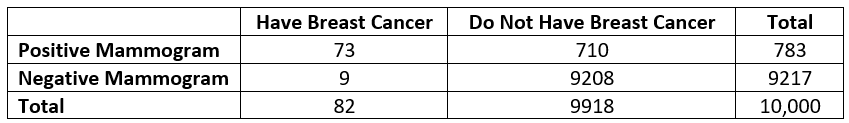
Problem Mammograms are typically used to screen women for breast cancer. Like most medical tests, they are not perfect. Some women who do not have breast cancer have a positive mammogram. This means that they do not have cancer, but the test indicates that the do. Other women test negative on the mammogram, but do have breast cancer. A test of 10,000 women who had a mammogram gave the following results.
Assume that these data apply to all women. Now let’s define some events:
+: a woman has a positive mammogram
-: a woman has a negative mammogram
C: a woman has breast cancer
C’: a woman does not have breast cancer.
We will use these events to answer the questions below.
a. What is the probability a woman has breast cancer?
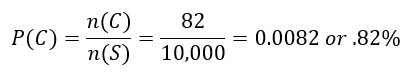
Solution In terms of our events, we are looking to calculate P (C ). To do this, we need to find the number of women with breast cancer and divide it by the number of women in the survey,
b. What is the probability that a woman has a positive mammogram?
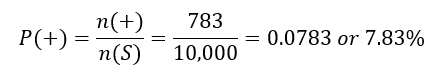
Solution In terms of our events, we are looking to calculate P (+ ). To do this, we need to find the number of women with a positive mammogram and divide it by the number of women in the survey,
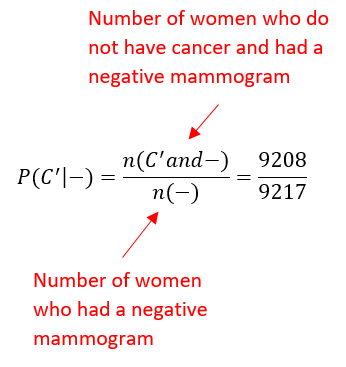
c, What is the probability that a woman has a negative mammogram and does not have breast cancer?
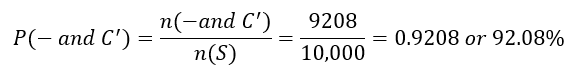
Solution Now things get a little more complicated. We are now interested in women with a negative mammogram and who do not have breast cancer. From the table, these are the women who are in the negative mammogram row and in the do not have cancer column, 9208. In terms of events, these are women in the event – and C’ (similarly Counting those women compared to the total number of women gives
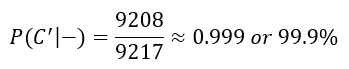
d. If a woman has a negative mammogram, what is the probability that she does not have breast cancer?
Solution In this part, we know a woman has had a negative mammogram. Of those women, we want to know what portion does not have breast cancer. Since we know something in advance, this is a conditional probability problem. We need to calculate the probability that a woman does not have cancer, given that the woman had a negative mammogram or P (C ’ | -).
To calculate this probability, we need to take into the account the fact that we know the woman had a negative mammogram. Based on the table, we know that 9217 women had a negative mammogram. Of these women, 9208 did not have cancer. This means that
Notice that we can also think of this symbolically as
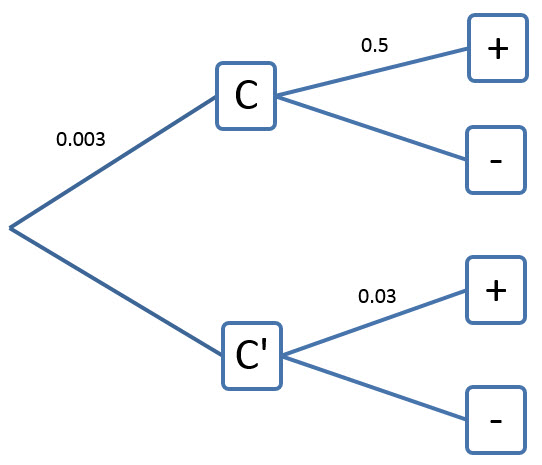
The probability of colorectal cancer can be given as .3%. If a person has colorectal cancer, the probability that the hemoccult test is positive is 50%. If a person does not have colorectal cancer, the probability that he still tests positive is 3%.
What is the probability that a person who tests negative does not have colorectal cancer?
To solve this problem, we’ll draw and label an appropriate tree diagram. Then we’ll apply Bayes’ Rule to the problem. Look at the information given in the problem. If
C is the event “person has colorectal cancer”
+ is the event “the hemoccult test is positive”
– is the event “the hemoccult test is negative”
we know that
P(C) = 0.003
P(+ | C) = 0.5
P(+ | C ′ ) = 0.03
This suggests the following tree diagram:
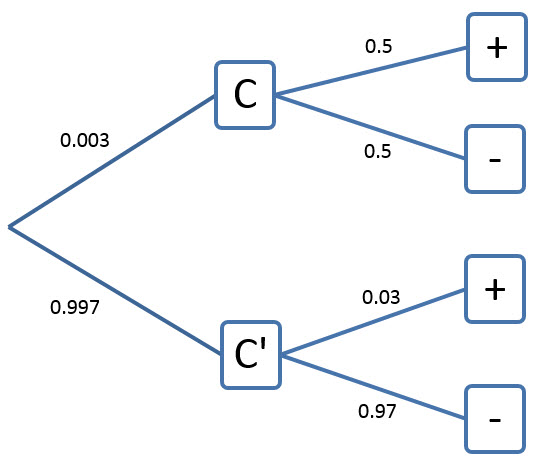
Knowing that the sum of the probabilities from one point on the tree should add to 1, we can finish the tree diagram as follows:
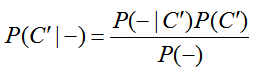
The probability we are looking for is P(C ′ | -). Notice that the tree diagram has P(- | C ′ ), but not the reverse conditional probability that we are looking for. This is a sign we need to use Bayes’ Rule. Let’s find the appropriate form of Bayes’ Rule. The relationship between the conditional probabilities is
Solving for P(C ′ | -) gives
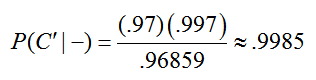
This is Bayes’ Rule for this problem. Now we are ready to use the tree diagram. P(- | C ′ ) and P(C ′ ) are both labeled on the tree diagram. We can calculate P(-) by following the branches on the tree diagram (multiply) that lead to a negative result, and then summing up the products from these branches.
Putting these values into Bayes’ Rule gives
This means that is you test negative, the likelihood that you do not have colorectal cancer is 99.85%. The test is quite good at screening that you do not have the disease.

 The Section 7.3 Homework contains problems about Bayes’ Theorem applied to medical testing. Let’s look at some resources to help you understand this type of problem.