It easy to confuse conditional probability with probability of an intersection of two event. They are related! The probability of an event A given that event B has occurred is

The vertical bar | means “given” and the event after it is the event that has already occurred.
Let’s look at some data to determine how to find several different probabilities including conditional probability.
Problem Mammograms are typically used to screen women for breast cancer. Like most medical tests, they are not perfect. Some women who do not have breast cancer have a positive mammogram. This means that they do not have cancer, but the test indicates that the do. Other women test negative on the mammogram, but do have breast cancer. A test of 10,000 women who had a mammogram gave the following results.
Assume that these data apply to all women. Now let’s define some events:
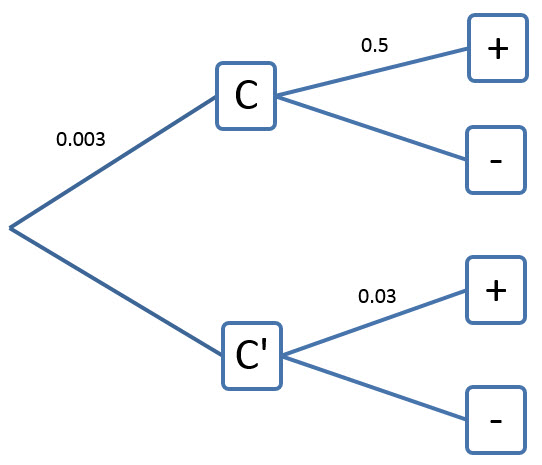
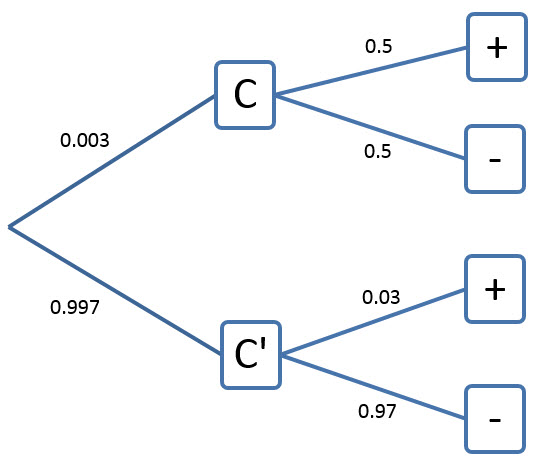
+: a woman has a positive mammogram
-: a woman has a negative mammogram
C: a woman has breast cancer
C’: a woman does not have breast cancer.
We will use these events to answer the questions below.
a. What is the probability a woman has breast cancer?
Solution In terms of our events, we are looking to calculate P (C ). To do this, we need to find the number of women with breast cancer and divide it by the number of women in the survey,
b. What is the probability that a woman has a positive mammogram?
Solution In terms of our events, we are looking to calculate P (+ ). To do this, we need to find the number of women with a positive mammogram and divide it by the number of women in the survey,
c, What is the probability that a woman has a negative mammogram and does not have breast cancer?
Solution Now things get a little more complicated. We are now interested in women with a negative mammogram and who do not have breast cancer. From the table, these are the women who are in the negative mammogram row and in the do not have cancer column, 9208. In terms of events, these are women in the event – and C’ (similarly Counting those women compared to the total number of women gives
d. If a woman has a negative mammogram, what is the probability that she does not have breast cancer?
Solution In this part, we know a woman has had a negative mammogram. Of those women, we want to know what portion does not have breast cancer. Since we know something in advance, this is a conditional probability problem. We need to calculate the probability that a woman does not have cancer, given that the woman had a negative mammogram or P (C ’ | -).
To calculate this probability, we need to take into the account the fact that we know the woman had a negative mammogram. Based on the table, we know that 9217 women had a negative mammogram. Of these women, 9208 did not have cancer. This means that
Notice that we can also think of this symbolically as
This is the same formula as
but with C’ instead of A and – instead of B.