How Do You Find The Equation Of A Line?

In this FAQ, I’ll demonstrate how we can use y = mx + b to find equations of lines. No need to memorize other equations of lines…it is easier to focus on the data given to us an use it to find m and b.

Let’s look at the most basic example that illustrates this process.

a. Find the equation of a line through the point (4, -6) with slope – 3/4.

Start by substituting m = -3/4  in the slope-intercept form to yield

y = – 3/x + b

Now substitute the point into the line by setting x = 4 and y = -6. This leads to

Using this value for b in the slope-intercept form above give the line y = –3/4 x -3. The answer to the problem is the equation of the line with the appropriate values for m and b.

Now let’s complicate matters a bit by finding the equation of a line passing through two points.

b.  Find a line through the points (-1, 3) and (2, 6).

The slope through the points is

Substitute the slope into the slope-intercept form to give

y = x + b

Now take one of the points and substitute it into this equation. Using the ordered pair (2, 6), we can solve for b:

This gives us the equation y = x + 4.

In both of these examples we applied the same strategy of putting in the slope m and then solving for the intercept b.

Now let’s look at a problem whose wording might throw you off.

c.  Find a line with x-intercept of -5 and a y-intercept of 4.

Don’t let the fact that they talk about intercepts throw you off the strategy. These intercepts can be written as ordered pairs (-5, 0) and (0, 4). The slope between these points is

This leads to the line

y = 4/5 x + b

Since the y-intercept is 4, we can substitute it into this line for b to give y = 4/5 x + 4 .

This problem is even easier since the y intercept was given to us. In each case we can start from y = mx + b and then find the value of m and b.

How Do You Compute Conditional Probability From Data?

It easy to confuse conditional probability with probability of an intersection of two event. They are related! The probability of an event A given that event B has occurred is

The vertical bar | means “given” and the event after it is the event that has already occurred.

Let’s look at some data to determine how to find several different probabilities including conditional probability.

Problem Mammograms are typically used to screen women for breast cancer. Like most medical tests, they are not perfect. Some women who do not have breast cancer have a positive mammogram. This means that they do not have cancer, but the test indicates that the do. Other women test negative on the mammogram, but do have breast cancer. A test of 10,000 women who had a mammogram gave the following results.

Assume that these data apply to all women. Now let’s define some events:

+: a woman has a positive mammogram

-: a woman has a negative mammogram

C: a woman has breast cancer

C’: a woman does not have breast cancer.

We will use these events to answer the questions below.

a. What is the probability a woman has breast cancer?

Solution In terms of our events, we are looking to calculate P (C ). To do this, we need to find the number of women with breast cancer and divide it by the number of women in the survey,

b. What is the probability that a woman has a positive mammogram?

Solution In terms of our events, we are looking to calculate P (+ ). To do this, we need to find the number of women with a positive mammogram and divide it by the number of women in the survey,

c, What is the probability that a woman has a negative mammogram and does not have breast cancer?

Solution Now things get a little more complicated. We are now interested in women with a negative mammogram and who do not have breast cancer. From the table, these are the women who are in the negative mammogram row and in the do not have cancer column, 9208. In terms of events, these are women in the event – and C’ (similarly  Counting those women compared to the total number of women gives

d. If a woman has a negative mammogram, what is the probability that she does not have breast cancer?

Solution In this part, we know a woman has had a negative mammogram. Of those women, we want to know what portion does not have breast cancer. Since we know something in advance, this is a conditional probability problem. We need to calculate the probability that a woman does not have cancer, given that the woman had a negative mammogram or P (C ’ | -).

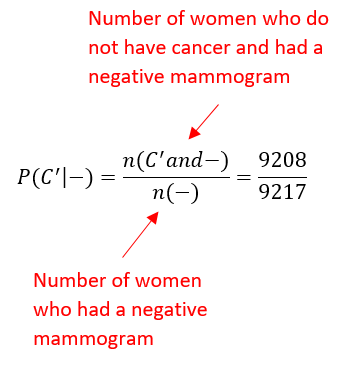
To calculate this probability, we need to take into the account the fact that we know the woman had a negative mammogram. Based on the table, we know that 9217 women had a negative mammogram. Of these women, 9208 did not have cancer. This means that

Notice that we can also think of this symbolically as

This is the same formula as

but with C’ instead of A and – instead of B.

How Are Cutoff’s Determined On “The Curve”?

In your classes, you might hear about instructors who grade on “a curve”. There is an idea that this might somehow benefit you when it comes to grading. Let’s take a look how that might work if the curve is a normal curve.

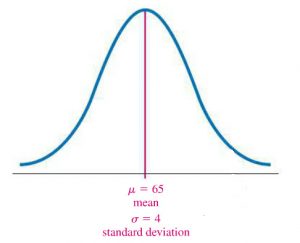
Problem Suppose you and your classmates take an exam that has a mean of 65 and a standard deviation of 4. If the instructor says the top 10% of scores earns an A, what is the cutoff for an A?

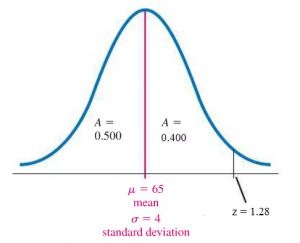
Solution Pictorially, the frequency distribution look like the bell curve below.

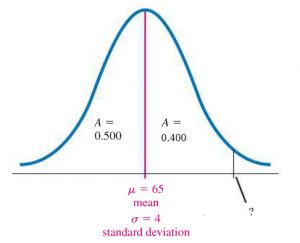
We know that 50% of the test score lie on the left side of the mean so the area on the left side of the mean and under the bell curve is 0.5. Now let’s label a point on the right hand side of the mean where 40% of the scores are from the mean to that point.

At the point labeled by ?, 90% of all scores are below this point (or 10% of scores are above this point).
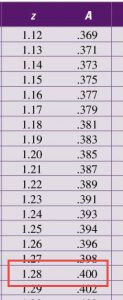
We can locate this point using a table of z-scores and areas. Look for the z score that corresponds to an area of A = 0.4.

Examining the data, we see that this corresponds to a z-score of 1.28.

But what is the data or raw score that corresponds to a z-score of 1.28?

To find this data value, start with the formula for z-scores,

And put in the values:

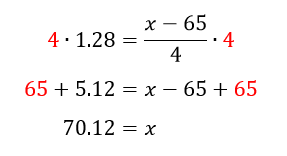
To solve for the data value x, multiply both sides by 4 and then add 65 to both sides.

This tells us that 90% of scores lie below 75.12 and 10% of the scores are above 75.12. To earn an A, you would need to score greater than 75.12.

How Do You Make An Amortization Table?

Let’s look at a loan problem to see where the payment and amortization table comes from.

Suppose you want to borrow $10,000 for an automobile. Navy Federal Credit Union offers a loan at an annual rate of 1.79% amortized over 12 months.

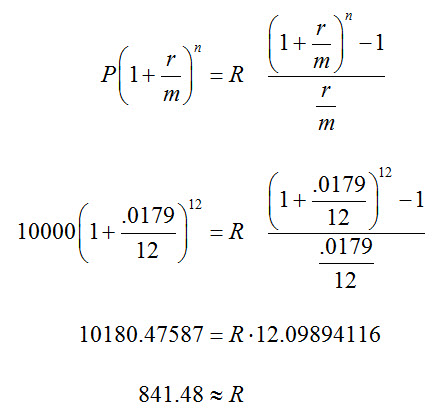
a. What are the payments?

To answer this, we need to put the numbers into the appropriate formula and solve for R:

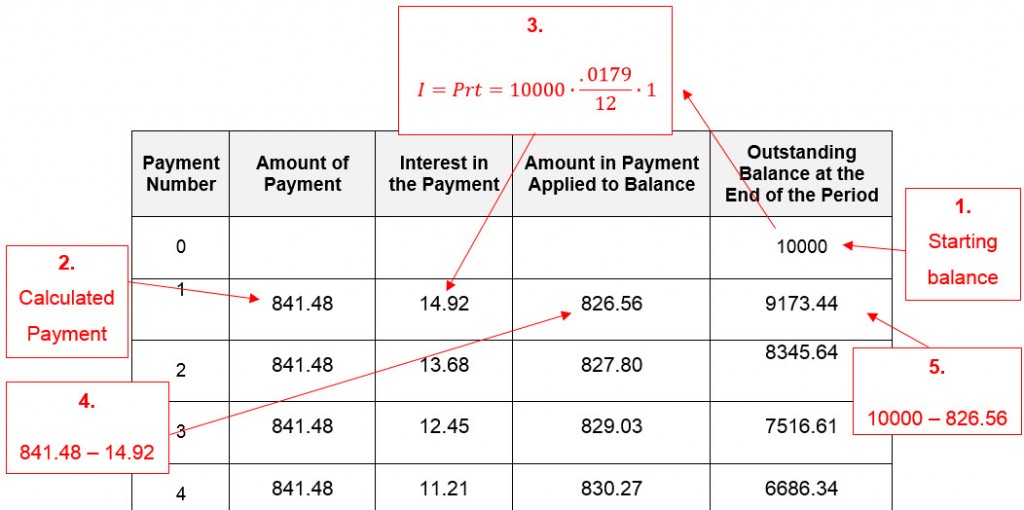
b. Find an amortization table.

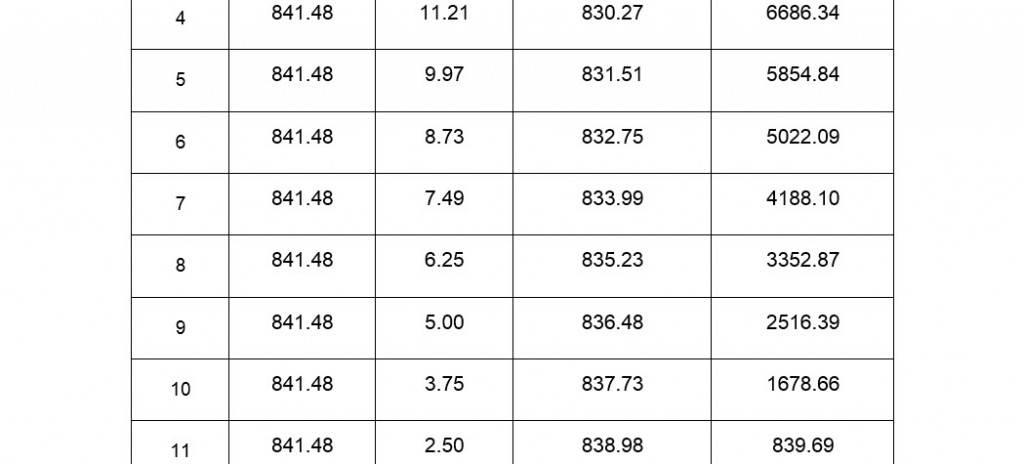
With the payment in hand, we can start filling out the table. Keep in mind that a payment for a credit card is calculated differently. In that case, the minimum payment is the interest plus some percentage of the new balance. In the screens below, you may click on the image for a larger version.

The first few steps consist of filling out Payment 0 and 1:

The interest is calculated with the monthly interest rate of the outstanding balance from the previous period. The amount applied to the balance is the difference between the payment and the interest.

Subsequent rows of the table are calculated in the same way until the final payment.

In the last payment, the principal applied to the balance must be equal to the outstanding balance in Payment 11.

Once that amount applied to the balance is in the 12th payment, then the interest may be calculated, The last payment is then found by adding the interest and the amount applied to the balance.

How Do You Find Compound Interest Future Value In Google Sheets?

Spreadsheets have several built in functions for working with compound interest and annuities. To use these functions, we’ll start with a standard sheet.

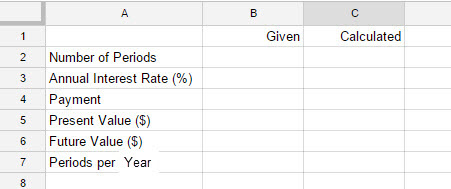
sheets_financial_01

This worksheet contains the variables used throughout Chapter 8. These variables correspond to these letter used in the text.

  • Number of periods is n
  • Annual interest rate is r
  • Payment is R
  • Present value is P
  • Future value is A
  • Periods per year is m

Values given in a problem will be entered in column B. Values calculated by the spreadsheet will be entered in column C. We will also assume that amounts paid out are negative and amounts received are positive.

Continue reading “How Do You Find Compound Interest Future Value In Google Sheets?”