Carrie Green is working to raise money for the homeless by sending information letters and making follow up calls to local labor organizations and church groups. She discovers that each church group requires 2 hours of letter writing and 1 hour of follow up while for each labor union she needs 2 hours of letter writing and 3 hours of follow up. Carrie can raise 100 dollars from each church group and 200 dollars from each union local, and she has a maximum of 16 hours of letter writing time and a maximum of 12 hours of follow up time available per month. Determine the most profitable mixture of groups she should contact and the most money she can raise.
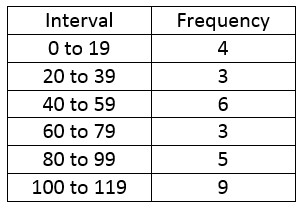
Suppose we are given some frequencies corresponding to some data in intervals.
To find the mean, we need to find a representative data value from each interval.
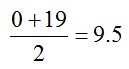
We’ll use the midpoint of each interval. The midpoint for the first interval is
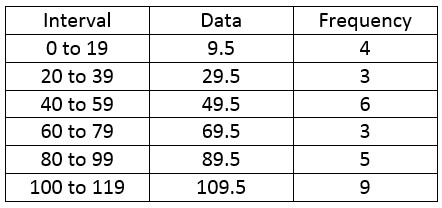
We can find the other midpoints in a similar manner. Let’s add this to the table.
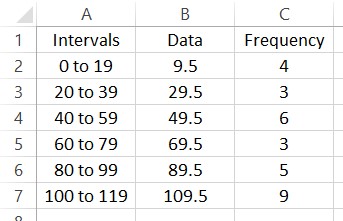
Let’s put this information in a spreadsheet.
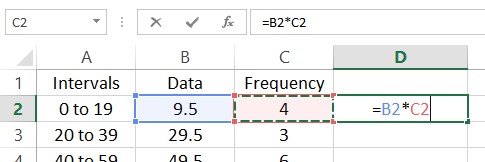
To find the mean of this frequency distribution, multiply each data value times its corresponding frequency. In the spreadsheet, put =B2*C2 in cell D2.
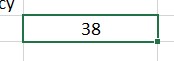
Press Enter to compute this value. Next we need to fill this value into the cells D3 through D7. Click on cell D2. The cell will be outlined like you see below.
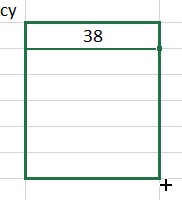
Place your mouse over the box in the lower right hand corner of this outline. The cursor will change to a black cross. Hold down the left mouse button and drag the cursor to cell D7.
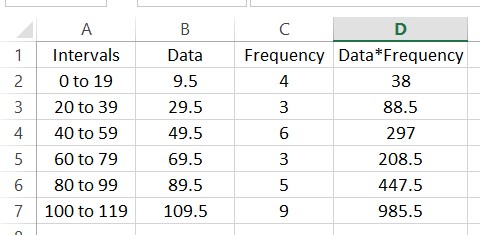
When you release the button, the products will be calculated for each row. Adding a label in cell D1 might help you to remember what the numbers in the cell are.
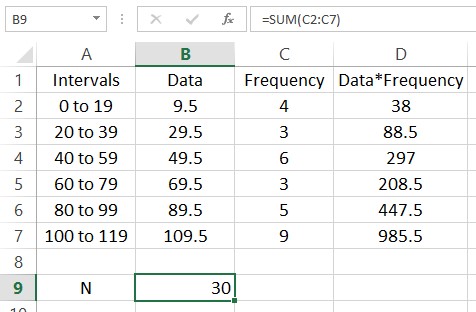
The function SUM is useful for adding up lists of numbers. For instance, we can find the sum of the frequencies N by typing =SUM(C2:C7). Put this formula in cell B9.
In this picture a label has been added in A9 to help the reader understand what is in the cell to the right. Add another label in cell A10 with the text “Mean”. Next to that cell we’ll calculate the mean of the data. This is done by adding the entries in column D and dividing by the sum of the frequencies in cell B9.
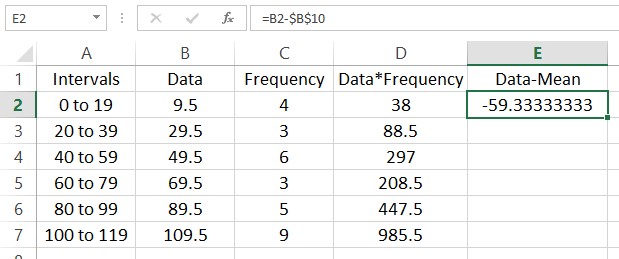
Finding the variance is a bit more complicated. In this calculation we need to subtract the mean from each data value and square the result. This needs to be done with an absolute reference to cell B10 so that the fill always refer to that cell in making the calculation. Start by clicking in cell E2 and typing =B2-$B$10.
This means that the data value 9.5 is approximately 59.3 units below the mean. Fill the rest of the column and we end up with this worksheet.
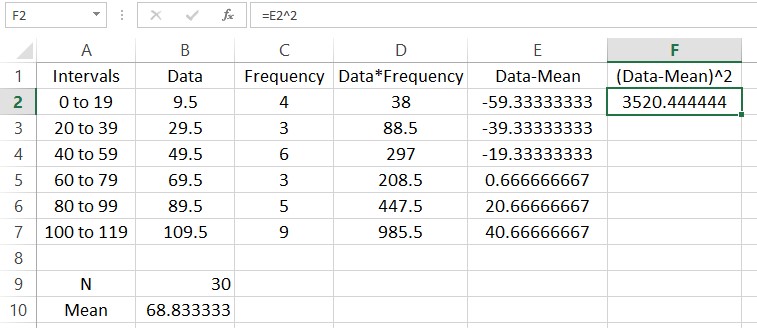
We could sum these deviation now, but the positive and negative nature of each row would mask the spread of the data. Squaring each of the entries makes each of them positive. In cell F2, type =E2^2.
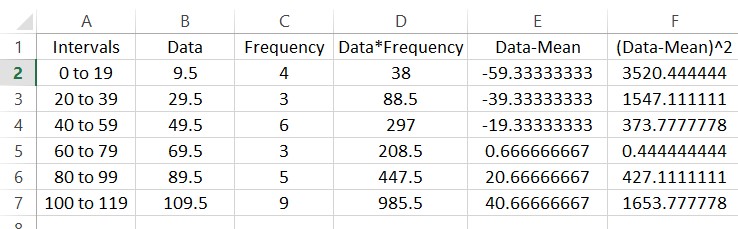
Fill the rest the rows using a fill.
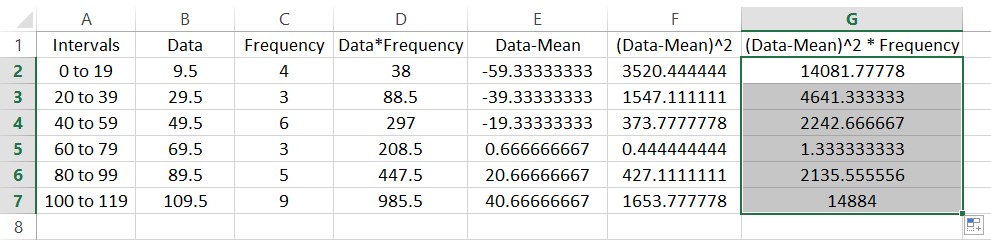
The entries in this column are often called the deviations from the mean squared. Each of these occur with the frequencies in column C. To find the sample variance, multiply the entries in column F by the frequencies in column C to give the worksheet below.
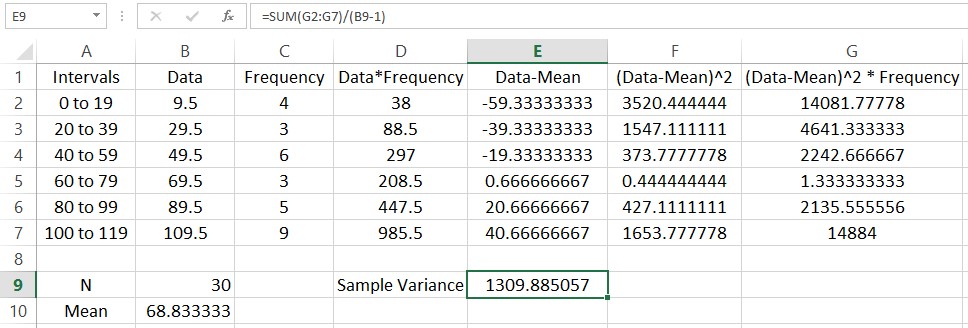
Let’s calculate the variance. Start by typing a label for the sample variance in cell D9. In the adjacent cell we’ll put the value. The variance is the sum of the entries divided by the sum of the frequencies minus 1. In cell E9, type =SUM(G2:G7)/(B9-1).
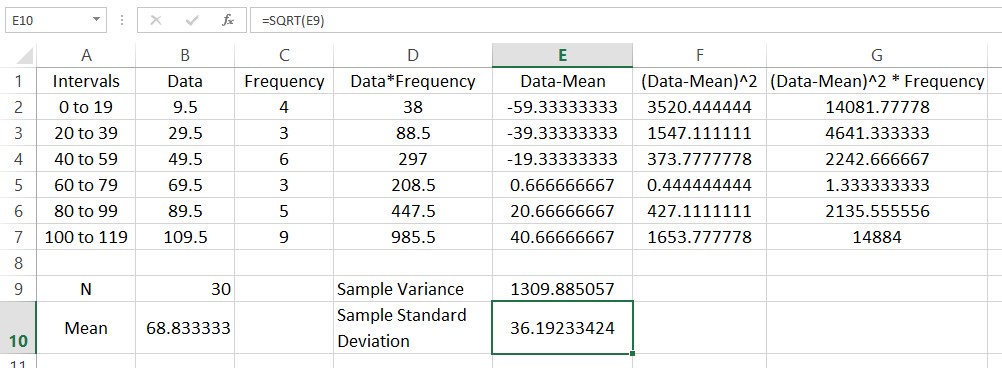
The sample standard deviation is the square root of the standard variance. We can take the square root using the function SQRT. Put a label in cell D10 and type =SQRT(E9) in the adjacent cell.
The standard deviation is a measure of how spread out the frequency distribution is around the mean.
Many of you may already be familiar with using a graphing calculator to put a matrix in reduced row echelon form. Did you know that you can do the same thing with WolframAlpha?
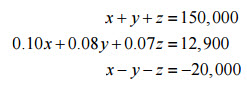
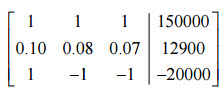
To see how this is done, let’s start from the system of linear equations
Convert this system into a 3 x 4 augmented matrix:
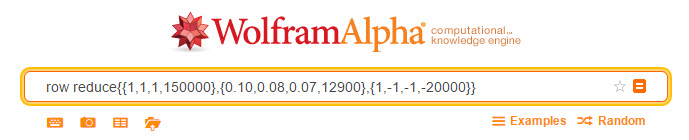
WolframAlpha understands several commands for putting an augmented matrix into reduced row echelon form. You can use the command rref { }or the command row reduce { }. The matrix goes inside the curly brackets. However, the matrix must be put in carefully. Each row needs to be typed in inside of curly brackets with the entries separated by a commas. In this case, you would type
on the command line in WolframAlpha.
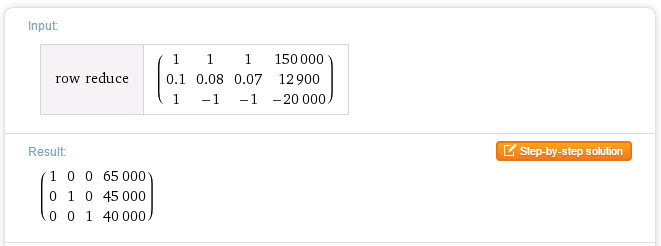
After you press Enter, the reduced row echelon form is computed,
A stock brokerage is grading its trainees by evaluating their stock picks over a 6 month period. The company has analyzed the trainees’ stock portfolios and computer usage to determine that 60% of the stocks picked by the trainees were up in the 6 month period and 45% of the trainees do research on their stock picks. In addition, the brokerage determined that of the stocks that were up, 30 of the trainees picking a particular stock did research on the stock and 30 of the trainees picking a particular stock did not do any research on the stock.
By Dipsey, via Wikimedia Commons
If a trainee buys the stock of a company they have researched, what is the likelihood that the stock was up over the 6 month period?
Before we start calculating haphazardly, let’s define two events for the problem:
S is the event that a stock that was picked by a trainee was up
R is the event that a trainee did research on a stock that they picked
In terms of these events, we need to find the probability P(S | R), the probability that a stock picked by a trainee was up, given that that stock pick was researched by the trainee. Now let’s examine the information in the problem statement.
The statement says, “60% of the stocks picked by the trainees were up in the 6 month period.” This information is given as a percentage so it corresponds to an empirical probability. In terms of the event S, it tells us that
P(S) = 0.60
The statement also says, “45% of the trainees do research on their stock picks.” This information relates to the event R and tells us that
P(R) = 0.45
The statement “the brokerage determined that of the stocks that were up, 30 of the trainees picking a particular stock did research on the stock and 30 of the trainees picking a particular stock did not do any research on the stock” relates the events S and R. By saying that “of the stocks that were up”, we are establishing that the following information corresponds only to stocks picked by the trainees that are up or that the information matches a conditional probability where we are given S. Additionally, we know that a total of 60 trainees picked stocks that were up since of the stocks that were up, 30 trainees did research and 30 did not do research. Based on this information,
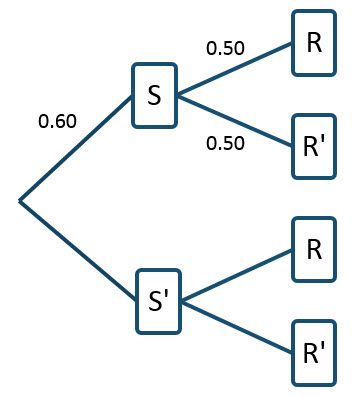
On a tree diagram, we can label the branches as shown.
For this particular way of constructing the tree diagram, the probability P(R) = 0.45 cannot be labeled on the diagram directly. Remember, we are looking for P(S | R) which is NOT the same as the probability P(R | S) = 0.5. To relate these conditional probabilities, utilize Bayes’ Rule in the form,
Solving for P(S | R), we get
Each of the probabilities on the right side we have already found and can be substituted to yield
This number does not have much meaning unless we compare it to the likelihood of picking a stock that is up, given that the trainee did not do any research on the stock, . Using Bayes’ Rule in this case yields
The only probability that we have not calculated is P(R′). Using the compliment rule, this is easily calculated as
Now we can return to Bayes’ Rule to calculate
In summary, we now know that
Now we can compare these two probabilities to draw conclusions about the events. Based on these numbers, we see that it is more likely that a stock chosen by a trainee goes up provided the do research. The probabilities P(S ′ | R) and P(S ′ | R′) can be found with similar versions of Bayes’ Rule.
To model a simple stock portfolio with two stocks, we’ll write down a system of two equations in two variables. We hope to find a unique solution to this system, so let’s make sure we understand two key ideas.
We need two variables.
We need two equations.
Why are these important?
Two Variables?
The variables represent the two unknown quantities we are looking for. Since we want to know how much two invest in each stock in a tow stock portfolio, the two variables will represent the amounts of money invested in each stock. If we had more stocks in the portfolio, we would need more variables to correspond to.
Two Equations?
If we hope to solve our system of linear equations for a unique solution, the number of equations must match the number of variables. This assumes that one of these equations is not redundant. For this model, we’ll get our equations from two pieces of information, the total amount invested in the portfolio and the total return desired.
For a larger portfolio, we would need more equations to specify a unique solution. In that case we would need more information such as an average beta for the portfolio.
Based on data from the end of January 2016, we know the following information.
Security
Annual Dividend Yield
Beta
Tootsie
1.16%
0.7
Diebold
4.45%
1.51
Our goal for this example is to invest a total of $50,000 with a total dividend return of 3%. This is attainable since one security in the portfolio has a higher yield and the other a lower yield. It would be impossible to combine the stocks in a portfolio to get a total yield higher that the highest yielding stock of lower than the lowest yielding stock.
Start with your variables. I’ll call mine x1 and x2 and describe them as
x1: amount invested in Tootsie
x2: amount invested in Diebold
Once you understand what these are, it is easy to use the information in the problem to write out the two equations.
Total Amount Invested Is $50,000
We can start to get mathematical by writing
Total Amount Invested = 50,000
To finish the equation, we need to write the left side of the equation in terms of the variables. A “total” indicates addition so write
x1 + x2 = 50,000
Total Dividend Return is 3%
If the total dividend return needs to be 3% of $50,000, we need a total of
3% of $50,000 = (0.03)(50,000) = 1500
This total dividend will come from the dividend on the Tootsie stock,
1.16% of the amount invested x1 = 0.0116 x1
and the dividend on the Diebold stock,
4.45% of the amount invested x2 = 0.0445 x2
So if the total dividend from the portfolio is $1500 and this is the sum of the dividend from each stock in the portfolio,
0.0116 x1 + 0.0445 x2 = 1500
Model for a Two Stock Portfolio
Combining the two equations together gives a system of two linear equations in two variable,
x1 + x2 = 50,000
0.0116 x1 + 0.0445 x2 = 1500
We can solve these graphically or algebraically. If we use the substitution method and solve them graphically, solve for x1 in the first equation to give
x1 = 50,000 – x2
Putting this into the second equation leads to
0.0116 (50,000 – x2)+ 0.0445 x2 = 1500
580 – .0116 x2 + 0.0445 x2 = 1500
0.0329 x2 = 920
x2 ≈ 27,963.53
If $27,963.53 is invested in Diebold, then x1 ≈ 50,000 – 27,963.53 or $22,036.47 must be invested in Tootsie.
The sum of these amounts is $50,000 as desired and the total dividend is