
Measuring Spread
In section 6.2, we focused on the central tendency of a dataset. In this section, we’ll examine how spread out the data is. On a histogram, the spread of the data is easy to notice.
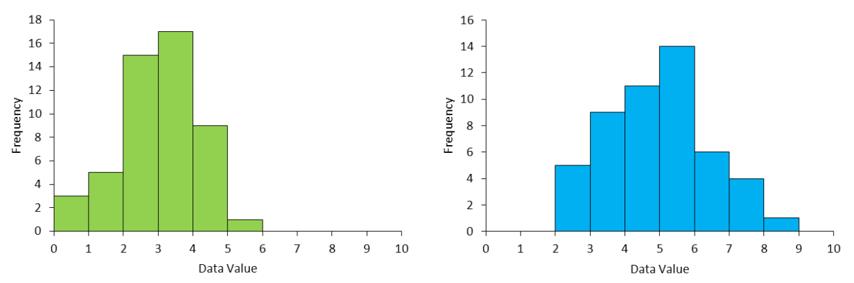
Figure 1 – The data in the histogram on the right is more spread out from its center than the histogram on the left.
Examining the histograms in Figure 1, we see the data values fall between 0 and 6 on the left. The data fall between 2 and 9 on the right indicating a slightly wider spread.
In this section, we’ll calculate several measures that indicate the spread of the data.
Read in Section 6.3
Section 6.3 Workbook (PDF)– 9/4/19
Watch Video
