Learning is deeper and more durable when it’s effortful. Learning that’s easy is like writing in sand, here today and gone tomorrow.
Using student projects is definitely effortful since it requires students to apply basic mathematical concepts to a problem with no unique solution. It helps them to distill the key parts of a problem and to put it into a mathematical framework. Since this framework is sustained over several projects, additional knowledge is acquired and organized in the brain so that new information is consistent with prior information. The projects I have designed take place over a large portion of the semester. In the case of College Algebra, students complete four projects over the fifteen week semester addressing a simple question.

This question brings up many connected questions.
- Is going to college worth it?
- How do you pay for college?
- How long does it really take to get a four year degree?
- How is it possible to predict what college will cost?
- How fast are college costs rising?
I bring this question up on the first day of class and distribute the first project letter soon after. Students are already familiar with this problem so it is not difficult to get them interested in forming a mental model of what is going on…the challenge is getting them to add new learning in the form of a mathematical model.
This letter sets the stage for the problem the students will solve. Each student uses a different set of data corresponding to average costs in a particular state and either four-year public or private college.
The learning objectives for this project are what you might guess. Since this is administered early in the semester, I want them to be able to graph data and functions. In addition, I want them to be able to find a linear function and interpret the slope of the model. Finally, I want them to be able to use function notation in a meaningful way (ie. in a context with more than one function. As outlined in the project letter above, several steps need to be carried out to come up with a linear model that passes through two of the four data points.
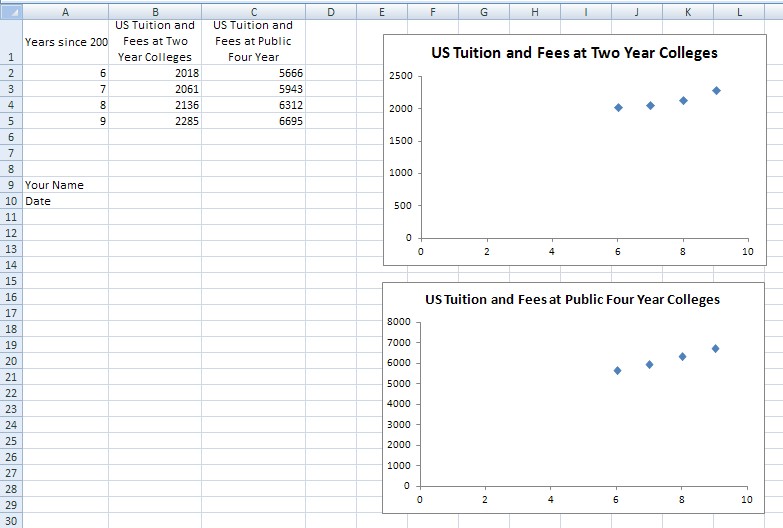
- Graph the data points in a scatter plot.
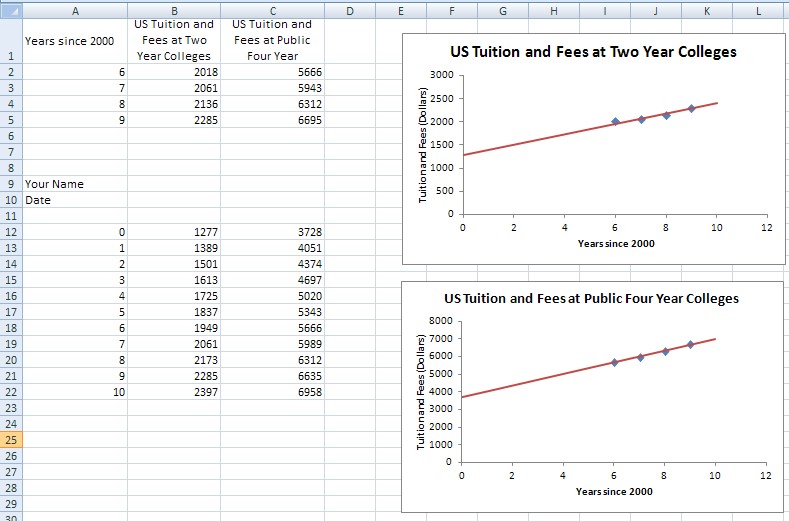
- Find the equation of the linear model.
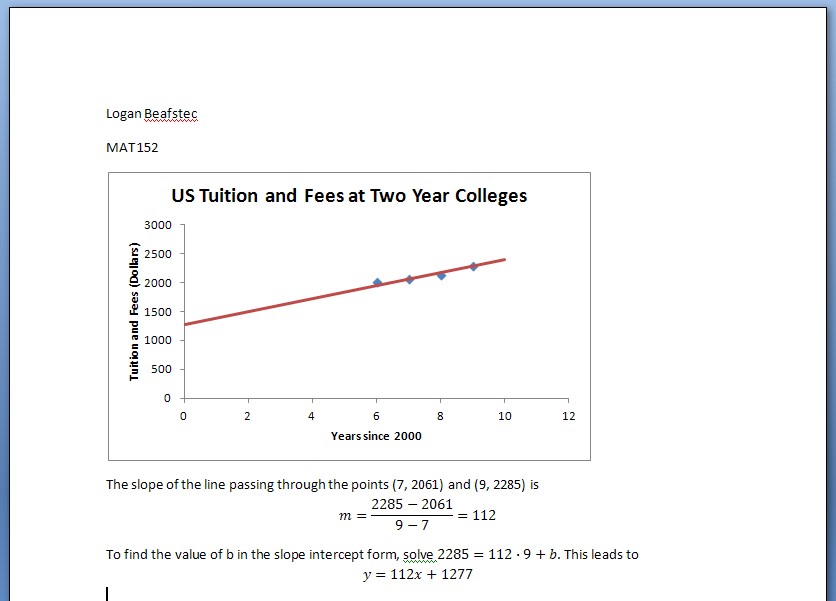
- Document how the model was found.
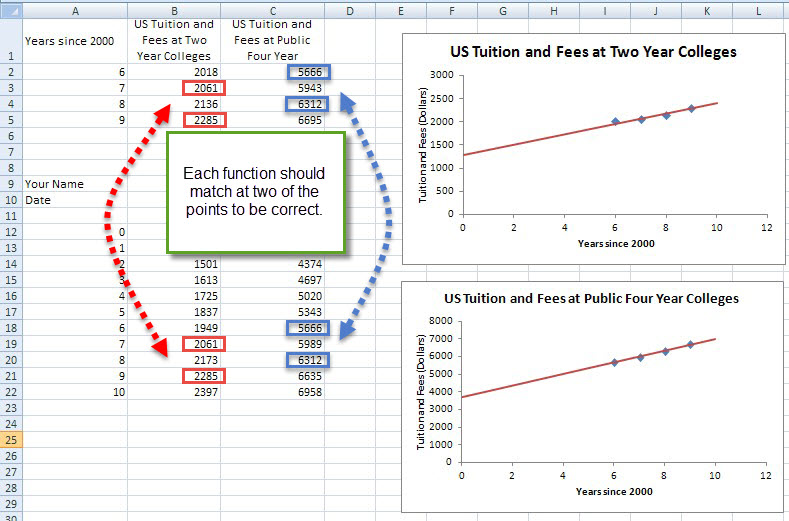
Weekly technology assignments allow me to see their progress on completing these steps. In each one I outline the mathematics they need to use as well as the technology tool they will use. For this series of projects, students use Excel to produce the graphs. The technology assignment gives full details on how to use Excel. below I will illustrate what the students will produce using a generic data set of college costs for the US. 
F(13) + F(14) + F(15) + F(16)
Similarly, the cost of attending two years of two-year college followed by two years of four-year college is
T(13) + T(14) + F(15) + F(16)
Students are able to apply function notation in this context. However, the savings are the difference between these two sums. Since the last two years are spent at four-year college, the only savings are in the first two years of college,
Savings = F(13) + F(14) – T(13) – T(14)
Most students focus on ALL four years of college instead of concentrating on the first two years. Understanding how this works requires each student to understand what each function represents as well as how algebra with functions may be carried out.
One interesting extension some students tackle is how to apply this strategy for other years. For instance, the savings from 2016-17 to 2019-2020 is
Savings = F(16) + F(17) – T(16) – T(17)
Using there graphs, they may then be able to explain whether the savings are getting bigger or smaller farther into the future.
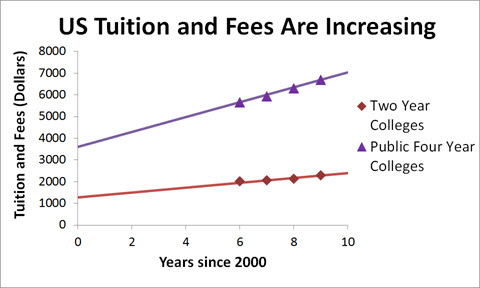
In the case of the functions pictured above, the graphs are getting farther apart so the savings must be getting greater. Quantifying this can lead some students to define
S(t) = F(t) – T(t)
This helps students to look at savings in each year.

