
Many problems require you to work with the compound interest formula.
Here are some FAQs that might help you to solve for various quantities in the formula.
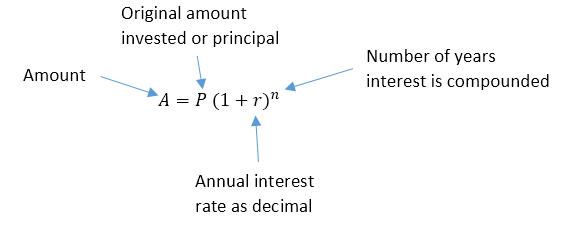
Many problems require you to work with the compound interest formula.
Here are some FAQs that might help you to solve for various quantities in the formula.
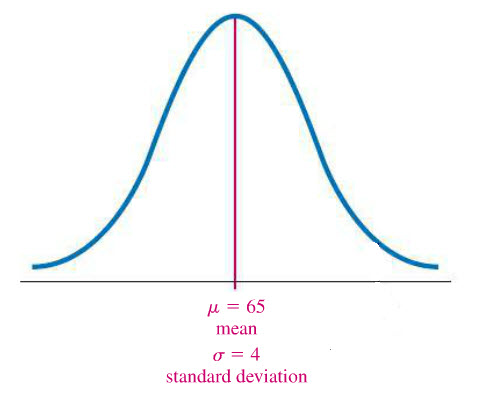
In your classes, you might hear about instructors who grade on “a curve”. There is an idea that this might somehow benefit you when it comes to grading. Let’s take a look how that might work if the curve is a normal curve.
It easy to confuse conditional probability with probability of an intersection of two event. They are related! The probability of an event A given that event B has occurred is

The vertical bar | means “given” and the event after it is the event that has already occurred.
Let’s look at some data to determine how to find several different probabilities including conditional probability.
 Problems in which you select members for a committee can involve combinations, permutations or both. This MathFAQ examines several similar problems that help to distinguish between permutations and combinations.
Suppose you are asked to determine whether a function is discontinuous. Many of you might use technology to help you graph a function to decide what the limits are from the left and right. Remember, a function is continuous at a point if the limits from the left and right are equal and also match the value of the function at the point.
Be aware that the TI calculators, WolframAlpha, and Desmos may give slightly different graphs and lead you to the wrong conclusion.
The new MathFAQ below demonstrates how to graph
in WolframAlpha and Desmos.
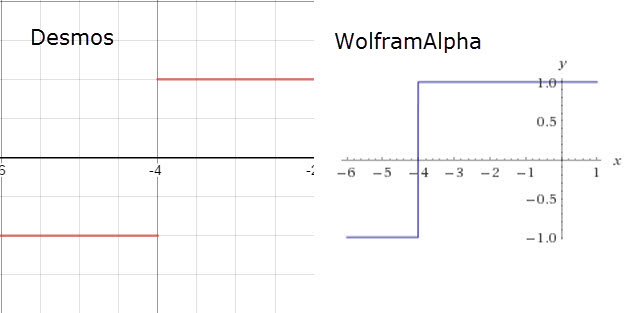
Notice how the graphs differ. Which one is the better graph to use if you are deciding if the function is discontinuous?