
Suppose you are asked to determine whether a function is discontinuous. Many of you might use technology to help you graph a function to decide what the limits are from the left and right. Remember, a function is continuous at a point if the limits from the left and right are equal and also match the value of the function at the point.
Be aware that the TI calculators, WolframAlpha, and Desmos may give slightly different graphs and lead you to the wrong conclusion.
The new MathFAQ below demonstrates how to graph
in WolframAlpha and Desmos.
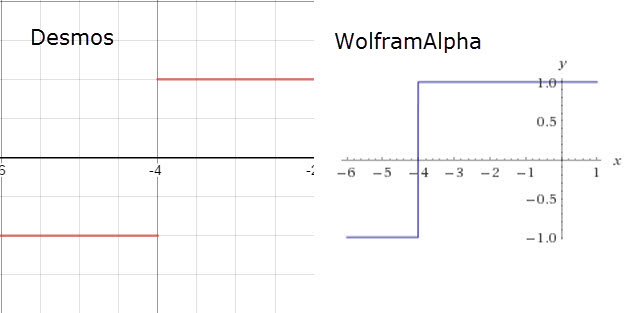
Notice how the graphs differ. Which one is the better graph to use if you are deciding if the function is discontinuous?