How Do You Find The Future Value Of An Annuity in Google Sheets?

Google Sheets has several built in functions for working with annuities. To use these functions, we’ll start with a standard Sheets worksheet.

sheets_financial_01

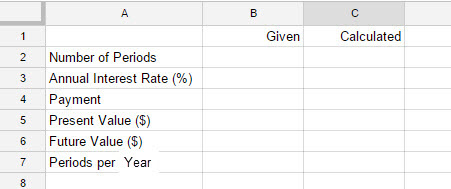
This worksheet contains the variables used throughout Chapter 5. Values given in a problem will be entered in column B. Values calculated by Sheets will be entered in column C. We will also assume that amounts paid out are negative and amounts received are positive.

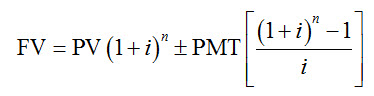
We’ll modify the worksheet shown above. This will allow us to use Sheets to calculate the different amounts in the annuity formula,

sheets_financial_19

This is done using two functions in Sheets, the FV (future value) function and the PV (present value) function. Annuities have a regular payment into or out of the account. If the payment is made at the end of the compounding period, the annuity is called an ordinary annuity. Payments are made at the beginning of the compounding period for an annuity due. In Sheets, amounts that you pay out are considered negative numbers and amount you receive are positive amounts.

Find the Future Value of the Annuity

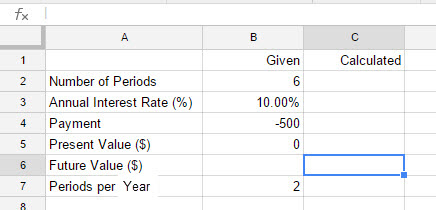
An investor deposits $500 in a simple annuity at the end of each six-month payment period. This annuity earns 10% per year, compounded semiannually.

a. Find the future value if payments are made for three years.

Solution Since the investor is paying $500 into the annuity, the payment must be entered as a negative number in Sheets.

1. Start from the basic worksheet and enter the values shown below.

sheets_financial_12

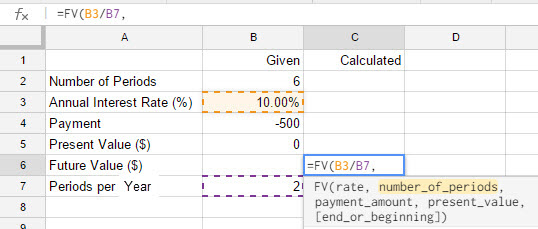
2. Click in cell C6. Type =FV( in the cell. As soon as you type the parentheses, Sheets recognizes what you are trying to do.

sheets_financial_13

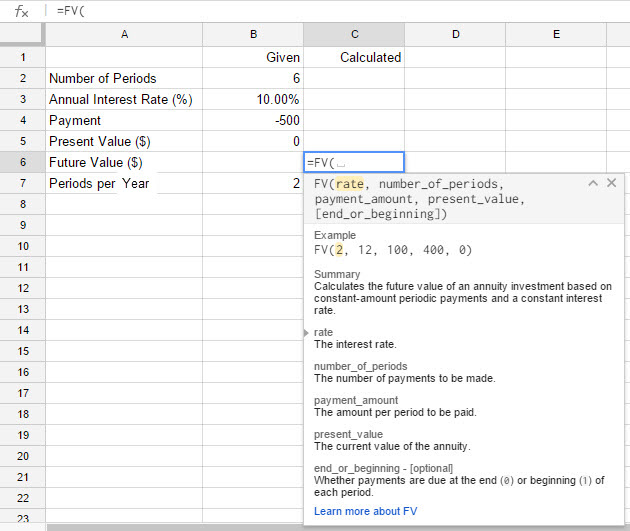
3. Notice that the word rate is highlighted. This indicates that you need to either type in the rate or the cell reference where the rate is located. The rate for the command is actually the interest rate per period. The annual interest rate is in cell B3 and the number of periods per year is in cell B7. We need to get the interest rate per period by typing B3/B7. You can also click in cell B3, type a /, and then click the cursor in cell B7. Now type a comma.

sheets_financial_14

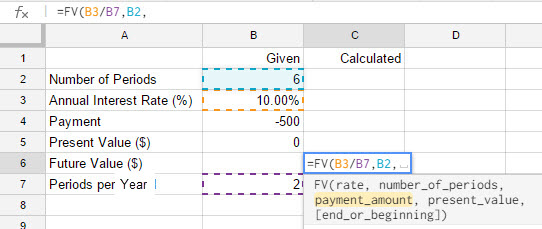
4. The number of periods is in cell B2. Type B2 or click the cursor in that cell. To continue to the next input, type a comma.

sheets_financial_15

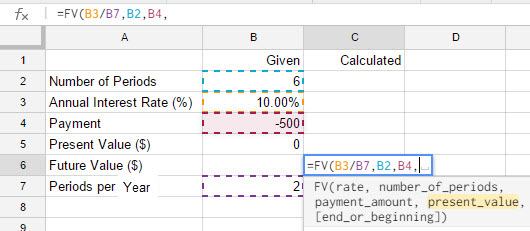
5. The payment is located in cell B4. The value is negative since the money is paid out. Type B4 or choose cell B4 followed by a comma.

sheets_financial_16

6. Since we deposit nothing into the account initially, the present value is zero. Enter B5 or select cell B5 followed by a comma and a parentheses. Press enter on the keyboard to calculate the future value.

sheets_financial_17

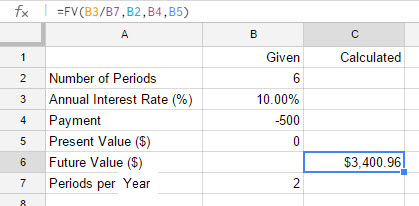
The future value of the annuity is $3400.96. There is an optional argument for the FV function. This argument indicates whether the annuity is an ordinary annuity (use 0 for the argument) or an annuity due (use 1 for the argument).

Ordinary Annuity: FV(B3/B7,B2,B4,B5,0)
Annuity Due: FV(B3/B7,B2,B4,B5,1)

If the last argument is not supplied, the annuity is assumed to be an ordinary annuity.

b. Find the future value if payments are made for 30 years.

Solution Thirty years of semiannual payments corresponds to n = 60. We need to make this change in the FV function, and solve for future value again. Change the value in cell B2 to 60.

sheets_financial_18

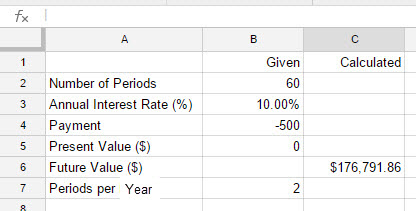
The future value is now $176,791.86.

How Do You Find The Equation Of A Line?

In this FAQ, I’ll demonstrate how we can use y = mx + b to find equations of lines. No need to memorize other equations of lines…it is easier to focus on the data given to us an use it to find m and b.

Let’s look at the most basic example that illustrates this process.

a. Find the equation of a line through the point (4, -6) with slope – 3/4.

Start by substituting m = -3/4  in the slope-intercept form to yield

y = – 3/x + b

Now substitute the point into the line by setting x = 4 and y = -6. This leads to

Using this value for b in the slope-intercept form above give the line y = –3/4 x -3. The answer to the problem is the equation of the line with the appropriate values for m and b.

Now let’s complicate matters a bit by finding the equation of a line passing through two points.

b.  Find a line through the points (-1, 3) and (2, 6).

The slope through the points is

Substitute the slope into the slope-intercept form to give

y = x + b

Now take one of the points and substitute it into this equation. Using the ordered pair (2, 6), we can solve for b:

This gives us the equation y = x + 4.

In both of these examples we applied the same strategy of putting in the slope m and then solving for the intercept b.

Now let’s look at a problem whose wording might throw you off.

c.  Find a line with x-intercept of -5 and a y-intercept of 4.

Don’t let the fact that they talk about intercepts throw you off the strategy. These intercepts can be written as ordered pairs (-5, 0) and (0, 4). The slope between these points is

This leads to the line

y = 4/5 x + b

Since the y-intercept is 4, we can substitute it into this line for b to give y = 4/5 x + 4 .

This problem is even easier since the y intercept was given to us. In each case we can start from y = mx + b and then find the value of m and b.

How Do You Find The Expected Value Of An Investment?

NYSE Twitter Cover

“NYSE Twitter Cover” by n.bhupinder is licensed under CC BY 2.0

Expected value is straightforward as long as you know all of the values of an experiment. If the values associated with each outcome are V1, V2, …, Vn and P1, P2, …, Pn are the corresponding probabilities, then the expected value is

E = P1·V1 + P2·V2 + … + Pn·Vn

This says that we need to multiply each value times the corresponding probability and then add up all of those products.

Let’s look at one example that can cause a little confusion.

Problem Assume that you have $10,000 to invest in stocks. The likelihoods of how much the stocks will change are given in the table below.

What would be the expected gain or loss (in dollars)?

Solution There is a tendency to look at the table above and to interpret the first column as the probabilities and the second column as the corresponding values. This is partially true. The first column is certainly the probabilities. For the second column to be the values, they have to be in dollars. Instead they are percentages.

To fix this problem, we need to figure out what a 6% gain is in dollars. If we are investing $10,000, a 6% gain is 6% of $10,000 or

.06 ·10,000 = 600 dollars

Let’s now update the table to have probabilities and values.

Now multiply the probabilities and add the results:

E = 0.5 · 600 + 0.3 · 0 + 0.2 · -200 = 260

This means that if you make this investment over and over, you can expect to gain $260 each time you make the investment.

How Do You Compute Conditional Probability From Data?

It easy to confuse conditional probability with probability of an intersection of two event. They are related! The probability of an event A given that event B has occurred is

The vertical bar | means “given” and the event after it is the event that has already occurred.

Let’s look at some data to determine how to find several different probabilities including conditional probability.

Problem Mammograms are typically used to screen women for breast cancer. Like most medical tests, they are not perfect. Some women who do not have breast cancer have a positive mammogram. This means that they do not have cancer, but the test indicates that the do. Other women test negative on the mammogram, but do have breast cancer. A test of 10,000 women who had a mammogram gave the following results.

Assume that these data apply to all women. Now let’s define some events:

+: a woman has a positive mammogram

-: a woman has a negative mammogram

C: a woman has breast cancer

C’: a woman does not have breast cancer.

We will use these events to answer the questions below.

a. What is the probability a woman has breast cancer?

Solution In terms of our events, we are looking to calculate P (C ). To do this, we need to find the number of women with breast cancer and divide it by the number of women in the survey,

b. What is the probability that a woman has a positive mammogram?

Solution In terms of our events, we are looking to calculate P (+ ). To do this, we need to find the number of women with a positive mammogram and divide it by the number of women in the survey,

c, What is the probability that a woman has a negative mammogram and does not have breast cancer?

Solution Now things get a little more complicated. We are now interested in women with a negative mammogram and who do not have breast cancer. From the table, these are the women who are in the negative mammogram row and in the do not have cancer column, 9208. In terms of events, these are women in the event – and C’ (similarly  Counting those women compared to the total number of women gives

d. If a woman has a negative mammogram, what is the probability that she does not have breast cancer?

Solution In this part, we know a woman has had a negative mammogram. Of those women, we want to know what portion does not have breast cancer. Since we know something in advance, this is a conditional probability problem. We need to calculate the probability that a woman does not have cancer, given that the woman had a negative mammogram or P (C ’ | -).

To calculate this probability, we need to take into the account the fact that we know the woman had a negative mammogram. Based on the table, we know that 9217 women had a negative mammogram. Of these women, 9208 did not have cancer. This means that

Notice that we can also think of this symbolically as

This is the same formula as

but with C’ instead of A and – instead of B.

How Do You Make An Amortization Table?

Let’s look at a loan problem to see where the payment and amortization table comes from.

Suppose you want to borrow $10,000 for an automobile. Navy Federal Credit Union offers a loan at an annual rate of 1.79% amortized over 12 months.

a. What are the payments?

To answer this, we need to put the numbers into the appropriate formula and solve for R:

b. Find an amortization table.

With the payment in hand, we can start filling out the table. Keep in mind that a payment for a credit card is calculated differently. In that case, the minimum payment is the interest plus some percentage of the new balance. In the screens below, you may click on the image for a larger version.

The first few steps consist of filling out Payment 0 and 1:

The interest is calculated with the monthly interest rate of the outstanding balance from the previous period. The amount applied to the balance is the difference between the payment and the interest.

Subsequent rows of the table are calculated in the same way until the final payment.

In the last payment, the principal applied to the balance must be equal to the outstanding balance in Payment 11.

Once that amount applied to the balance is in the 12th payment, then the interest may be calculated, The last payment is then found by adding the interest and the amount applied to the balance.