Section 6.3 Question 1

What is the range of the dataset?

The simplest way to determine the spread in a dataset is to find the difference between the highest and lowest values in the data. This measure of spread is called the range of the data.

Range

Range = Maximum Data Value – Minimum Data Value


Let’s apply this definition to the closing price of Ford stock over ten trading days in June of 2012.

Based on the closing prices, the stock closed highest on June 6 and lowest on June 4. The range is

Range = 10.57 – 10.04 = 0.53

The range is very easy to compute, but extreme values have a big effect on it. Since the highest and lowest values in the data are the only numbers need to compute the range, large changes in those two numbers will change the range by a large amount. This sensitivity is a weakness of measuring spread with the range.

Stock quotes often include several different ranges. Consider the quote below from Google Finance.

This quote includes two pieces of information that we may use to calculate the range of Pearson’s stock price. The range listed in the middle of the quote is . This is not the same range defined above. Instead, this is the lowest and the highest values of the stock price on July 11. We can use this information to calculate the range of the price for that day,

Intraday Range on July 11 = 19.45 – 19.26 = 0.19

The term “intraday” means within the day.

Next to 52 week we see the values 16.52 – 20.08. These values are the lowest and highest prices for Pearson stock in the previous 52 weeks. The difference between these values is the 52 week range,

52 week Range = 20.08 – 16.52 = 3.56

Each of these ranges is obtained from the stock price as it fluctuates over the day or year.

Section 6.2 Question 4

What is the mode of a dataset?

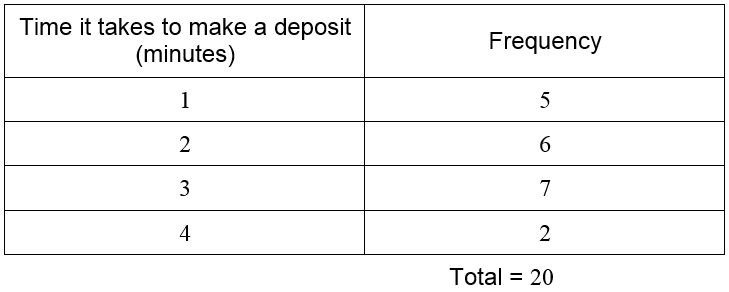
The mode of a dataset is the value that occurs most frequently in the data. In the dataset for the time it takes a customer to make a deposit, we were given the data below. The original data was shown in a table,

and used to create a frequency table.

The time of 3 minutes occurs seven times and is the most frequently occurring data value. Therefore the mode of this data is 3. Note that the mode is a data value and not the frequency associated with that value.

Example 6      Mode of Home Sales

During the week of 6/7/2012 through 6/14/2012, eight homes were sold in Paradise Valley, Arizona in the area code 85253. The sales prices for these homes are listed below.

900,000      535,000      182,500      1,550,000      2,250,000      1,525,000      490,000      1,525,000

Find the mode of the home sales prices.

Solution The home sale price of 1,525,000 occurs twice compared to all other prices occurring once. The mode is 1,525,000.


If a dataset has two values that occur most frequently, the data is said two have two modes. In this situation, we must make sure the mode is quoted as the two data values and not the frequency.

Example 7      Find the Mode

A used clothing retailer needs to insure that she has ample stock of dress sizes most commonly purchased by her customers. To do this, she offers a bounty of dress sizes that are in high demand. She surveys 16 customers and asks them what their dress size is.

12      6      14      18      10      14      8      10
16      16      20      16      16      14      14     8

a.   Find the mode of this dataset.

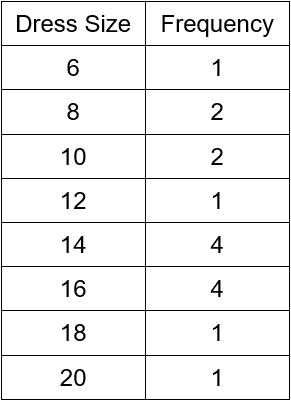
Solution To help determine which value occurs most frequently, construct a frequency table.

Sizes 14 and 16 occur most frequently with four occurrences each. The data has two modes at 14 and 16. She should offer top dollar to customers who wish to sell these sizes since she sells those sizes most frequently.

b.   Why is the mode a better choice for central tendency for this dataset?

Solution For this dataset, the mean is

Although this is the center of the data based on the size of the numbers, it is not useful to the retailer since dresses do not come in fractional sizes like 13.25.

The median of the data occurs at the mean of the data in eighth and ninth positions when listed in numerical order. From the frequency table we see that both of the numbers are 14 so the median is 14. This is a dress size, but focusing on reselling only size 14 would not be a good decision. Since size 16 occurs just a frequently among the customers surveyed, we would be overlooking a large portion of her customers if she placed a premium on size 14 only.


It is also possible for every occurrence in a dataset to occur with equal frequency. When this happens, the dataset has no mode.

Section 6.2 Question 3

What is the median of a dataset?

The mean has the disadvantage of being affected by extreme values in the data. For instance, suppose we find the mean of the data values 9, 7, 10, 9, and 15. Using the definition of the mean, we find

If we change the highest data value to an even higher value like 150, the mean increases significantly,

The median is a measure of central tendency that is not affected by extreme values (also called outliers) in the data.

Median

If the data is arranged in numerical order, the median is the center value that splits the data into two halves.


Once the data is arranged in numerical order, the center value may be determined by dividing the total number of data by 2. If the result is not an integer, round the quotient up to the nearest integer. The center value is located at this position when the data is listed in numerical order. If the quotient is an integer, the median is the mean of the data located in that position and the following position.

Example 4      Find the Median

Find the median of each set of data.

a.      9, 7, 10, 9, 15

Solution Start by arranging the data in numerical order.

7     9      9     10      15

There are five data values so the quotient for this dataset is 5/2 = 2.5. Rounding this value up to the nearest integer gives 3 indicating that the median is the third number when the data is written in numerical order. Since the third number is 9, the median is 9.

b.   49, 78, 92, 85, 79, 73

Solution Arrange the number is numerical order to give

49     73     78     79     85     92

This dataset has 6 values so 6/2 = 3. Since this number is an integer, the median is the mean of the values in the third and fourth positions in numerical order, 


In part a of Example 5, the median was found to be 9. Notice that the median of a similar set of data containing an extreme value is the same. The median of the data 7, 9, 9, 10, 150 is also 9. This is due to the fact that swapping 15 for 150 does not change the center value. For this reason, the median is not affected by extreme values.

Example 5      Compare the Mean and Median

During the week of 6/7/2012 through 6/14/2012, eight homes were sold in Paradise Valley, Arizona in the area code 85253. The sales prices for these homes are listed below.

900,000     535,000     182,500     1,550,000     2,250,000     1,525,000     490,000     1,525,000

a.   Find the mean sales price.

Solution Apply the definition of the mean to give

b.   Find the median sales price.

Solution The selling prices in numerical order are
182,500     490,000     535,000     900,000     1,525,000     1,525,000     1,550,000     2,250,000

Since the dataset has 8 values, the median is the mean of the home sales at positions four and five,

c.   Median sales prices are usually published instead of mean sales prices. Why is this a good idea?

Solution The mean is affected by extreme home sales. In this case, one of the home sales is 182,500 and is very low for this zip code. The low value drags the mean lower. In comparing the mean with the median, the mean is almost $100,000 lower because of this value. It is not desirable for an extreme home sale to affect the mean by so much so the median home sale is usually quoted instead of the mean home sale.


Section 6.2 Question 2

What is the mean of a dataset?

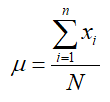
The mean or average of a set of data may be calculated for a sample or a population. For a population, the mean is named using the Greek letter μ (mu).

Population Mean

Let denote the ith observation of a variable x from a population with N total observations. The population mean is

You are probably already familiar with the computation. In simple terms, add up the data values and divide by the total number of data values.

The numerator of the mean is often written in sigma notation as Sigma notation indicates a sum where each term has the form xi. In each term, a different value if i is substitute from i = 1 to N. If we use sigma notation, the definition for population mean becomes

This definition may also be abbreviated by dropping the subscript i. In this case, we get

In each case, the mean is found by summing the data and dividing by the total number of data.

Example 1      Find the Population Mean

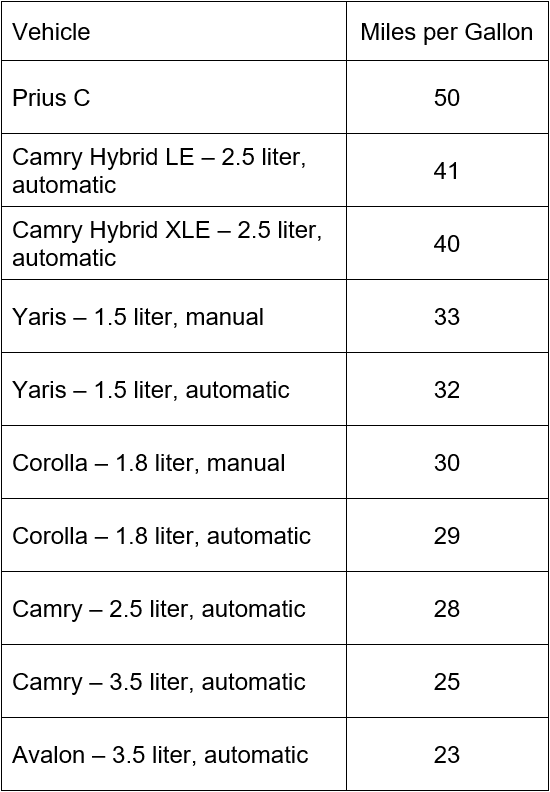
In 2012, Toyota claimed to have the most fuel efficient passenger car fleet. Based on mileage estimates from Edmunds.com, the table below shows the mileage of passenger vehicles manufactured by Toyota.

Use this table to find the mean miles per gallon for Toyota passenger vehicles in 2012.

Solution Since the data in the table include the miles per gallon for all Toyota passenger vehicles, this data constitutes a population. If we were using this group of vehicles to find the mileage of all Toyota vehicles, then it would have been a sample from the larger population of Toyota vehicles.

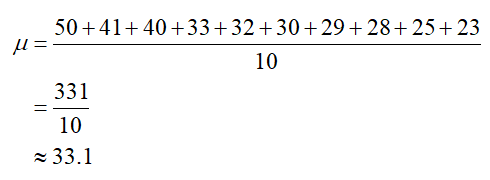
To find the mean, add the mileage values and divide by the total number of passenger vehicles in the Toyota fleet,

According to the mean, the center of the data values is approximately 33.1 miles per gallon.


When the mean is calculated from a sample of data drawn from a larger population, the mean is symbolized using.

Sample Mean

Let denote the ith observation of a variable x from a sample with n total observations. The sample mean is

The sample mean is calculated exactly the same way as the population mean. The main difference is how we think about the data. If the data values constitute a population, the mean is denoted μ. If the data values are a sample from a larger population, then the sample is denoted In either case, we add up to data values and divide by the total number of values to find the mean.

Example 2      Find the Sample Mean

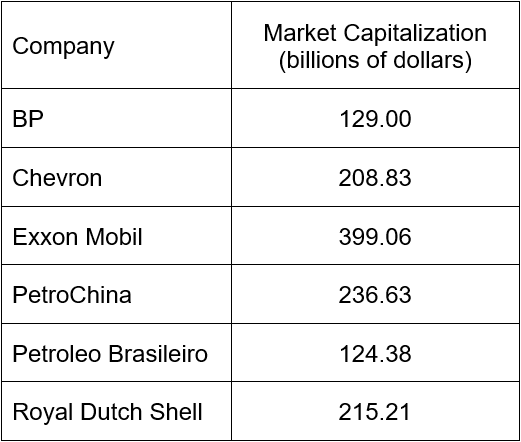
A sample of six companies are selected from companies in the energy sector on the New York Stock Exchange. The market capitalization (as of July 6, 2012) of each company is recorded in the table below.

a.   Find the mean market capitalization of these companies.

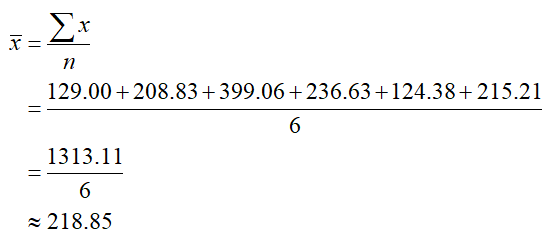
Solution The variable x represents the market capitalization. The sample mean is

b.   These six companies are the largest companies in the energy sector. Do you think the mean is reflective of the market capitalizations of the entire population of the energy sector?

Solution This sample contains six companies with the highest market capitalizations in the energy sector. The population of companies would contain many other companies with much smaller market capitalizations. Because of this, the population mean would be much smaller. The sample mean is not representative of the market capitalizations for the entire energy sector.


The mean may also be calculated if the data is given in a frequency table. Instead summing all of the individual data, we multiply each data value by its frequency and add the products. Then we divide this sum by the total number of data.

Example 3      Mean of Data in a Frequency Table

In section 6.1, we constructed a frequency table for the time it takes a customer to make a deposit at a bank. The original data was shown in a table,

and used to create a frequency table.

a.   Use the frequency table to compute the sample mean for the twenty customers.

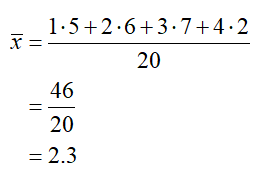
Solution This data was originally given as twenty separate values. Although we could simply list those values and add them to find the mean, it is easier to find the product of the times and their corresponding frequencies. When we do this, we get

The mean time it took customers to make a deposit in this sample is 2.3 minutes.

b. Use the original data to find the sample mean for the twenty customers.

Solution Add the data and divide by the total number of data,

The sum in the numerator is the same if a frequency table or the original data is used. If the frequencies are available, it is easier to multiply them times the data value than adding all of the individual values.

Section 6.2 Question 1

What is the difference between a sample and a population?

In Section 6.1, we graphed several datasets. In particular, we examined the dividend yields of several companies belonging to the energy sector on the New York Stock Exchange. These companies are a smaller portion of a larger group of companies. Depending on the perspective, they could be considered a smaller part of all companies in the energy sector on the New York Stock Exchange. Or they could be considered a small part of companies on the New York Stock Exchange in general. When we examine a smaller portion of data from a larger set, the smaller portion is called a sample. The sample is selected from a larger set of data called the population.

In statistics, we are often interested in how the numbers we calculate for the sample relate to the numbers we might calculate from the population. Calculating an average from a sample instead of an average from a population may be much convenient and cost effective.

For instance, every day shipping containers enter ports around the United States with parts destined for factories. A single container may contain a huge number of parts. Ideally, every part in the container will be free of defects. However, every container will have a certain proportion of parts that are not usable. It is not cost effective to examine every single part in the container. Instead, a smaller sample is selected from the container. If the proportion of defective parts is too high, the contents of the entire container are rejected. The population is all of the parts in the container and the sample is the smaller group that is selected from this population.

Measures calculated from a sample are called statistics. Measures calculated from a population are called parameters. It is very common for a business to use a small sample of data drawn from a much larger population. Businesses routinely launch products in small test markets to gauge interest. If the product is successful for the sample of consumers in the test market, it might be successful in the larger population of American consumers. The test markets are chosen very carefully to insure the parameters calculated from the sample are reflective of the statistics from the population.